
$XRP surges above key moving averages as short liquidations mount and bullish momentum accelerates, pushing price toward the top of its range and signaling a potential trend reversal that traders are closely watching.
$XRP Breakout Gains Strength as Shorts Get Squeezed
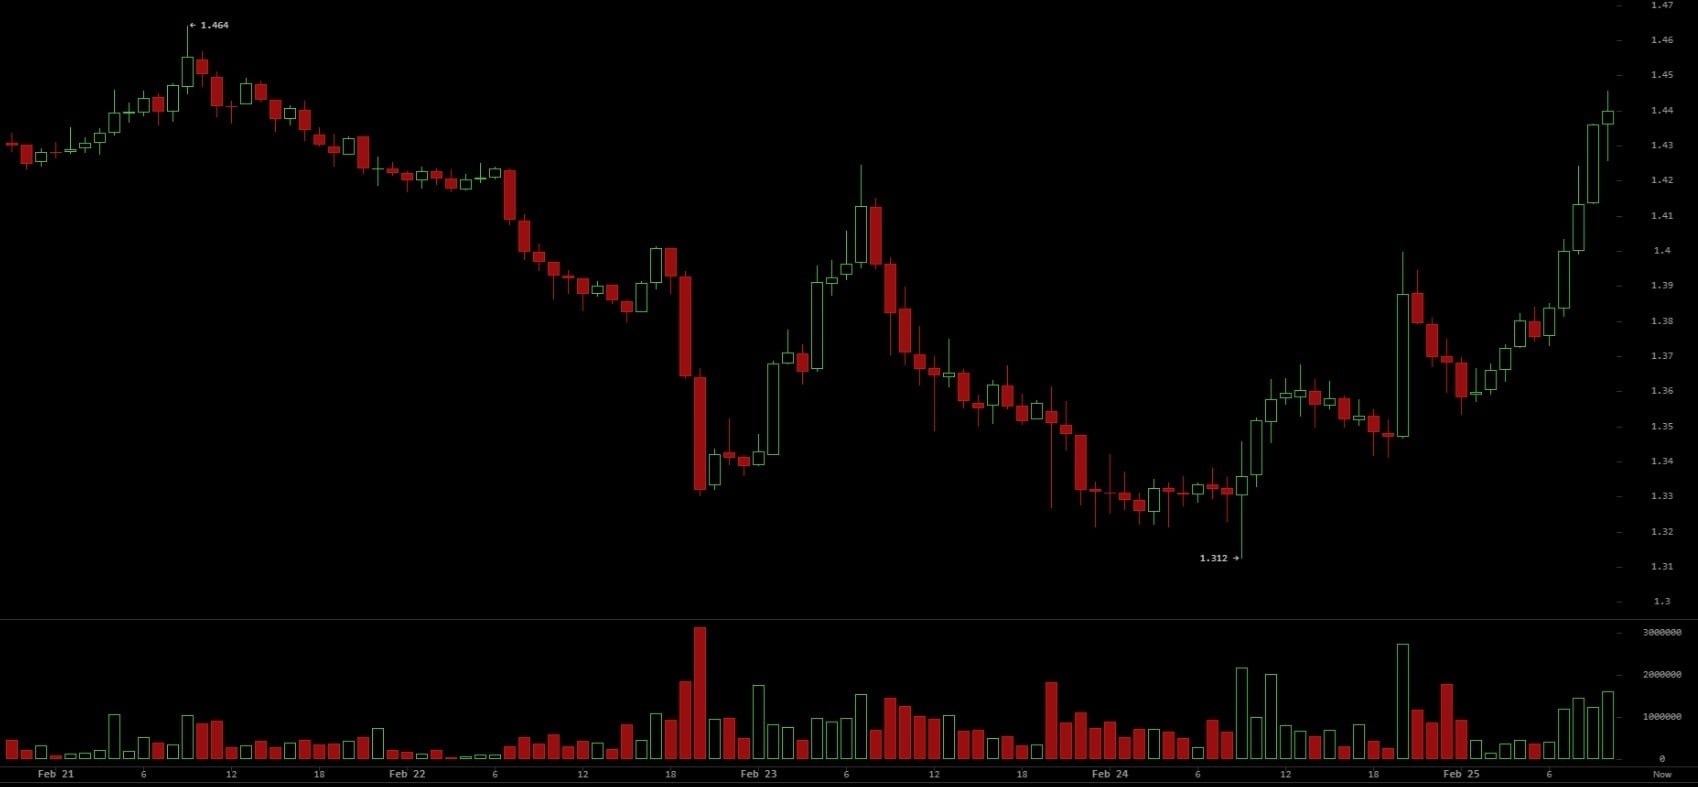
At 10:51 on Feb. 25, $XRP is trading at $1.44194, up 7.02% over the past 24 hours. The session has produced a high of $1.44570 and a low of $1.34092, with price pressing near the top of that range as bullish momentum accelerates. The latest hourly candles show a sharp expansion to the upside, with $XRP breaking higher after stabilizing above recent support.
From a short-term perspective, $XRP has transitioned from a multi-day slide into a decisive rebound. After falling from levels above $1.60 earlier in the displayed period and forming a base in the $1.32–$1.34 zone, price began carving out higher lows before surging through the $1.37–$1.40 area. $XRP has reclaimed both the 50-period simple moving average at $1.35994 and the 200-period simple moving average at $1.40928, signaling an improving trend structure. Volume expanded during the breakout, reflecting stronger participation as buyers pushed price through key resistance levels.
Beyond the technical rebound, institutional positioning and derivatives data add important context. Coinglass data shows $XRP liquidations totaling $6,245,064 over the past 24 hours, with $4,439,249 tied to short positions and $1,805,814 to longs, indicating that the majority of forced closures were bearish bets. Over the same period, broader crypto market liquidations reached $363.37 million, heavily skewed toward short positions. At the same time, institutional flows are showing early signs of stabilization. On Tuesday, the Bitwise $XRP ETF recorded $3 million in net inflows, marking a shift from the outflows seen earlier in February. Total assets under management across $XRP ETFs are hovering around $981 million, suggesting institutional holders are defending the $1.30–$1.35 range as a longer-term entry zone even as short-term volatility spikes.
Technical indicators confirm the strength of the breakout. The Relative Strength Index ( RSI) stands at 78.18, firmly in overbought territory and reflecting aggressive buying pressure. The Moving Average Convergence Divergence ( MACD) shows the MACD line at 0.00771 above the signal line at 0.00108, with a positive histogram reading near 0.01779, signaling expanding bullish momentum. From a Moving Average (MA) standpoint, $XRP’s position above both the 50-period and 200-period simple moving averages marks a notable shift in bias. Bollinger Bands have widened, with the upper band near $1.43026 and the lower band around $1.32481, and price is pressing beyond the upper band, highlighting volatility expansion to the upside.
If $XRP can maintain acceptance above the $1.43–$1.44 zone, the breakout could extend as short-covering pressure subsides and buyers attempt to establish higher support. However, with RSI elevated and price stretched above the upper Bollinger Band, a period of consolidation or a pullback toward the $1.40 area would not be unusual before the next directional move develops.
FAQ 🧭
-
Why is $XRP rising sharply right now?
Strong buying momentum and heavy short liquidations are fueling the breakout above key resistance levels. -
What do $XRP’s moving averages signal for investors?
Trading above the 50-period and 200-period simple moving averages suggests a shift toward a more bullish trend structure. -
Does the high RSI reading pose a risk?
An overbought RSI indicates powerful momentum but increases the likelihood of short-term consolidation or pullback. -
How important is the $1.43–$1.44 zone?
Holding above that range could help $XRP establish higher support and sustain its upward breakout.