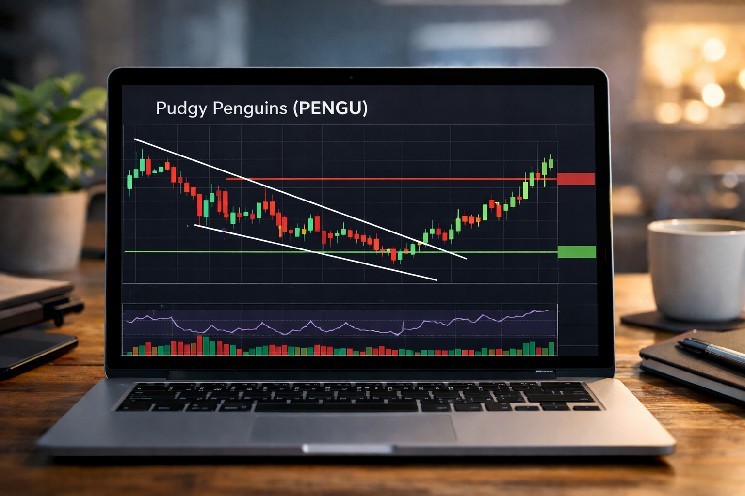
Notably, $PENGU held its key horizontal support levels like a rock before firing a sharp 17.36% gain.
This February “waddle back” rally shows that the token can hold up even when the broader market is weak.
Market catalysts, such as the launch of the Visa-powered Pengu Card, add real-world utility to the cryptocurrency, though regulatory delays affecting a $PENGU-linked NFT ETF have slowed some institutional inflows.
$PENGU technical analysis
The breakout has turned price compression into real gains.
However, $PENGU is still currently trading below all the moving averages, although the Relative Strength Index (RSI) indicator has already confirmed the rebound after hitting the oversold region.
$PENGU price chart | Source: TradingView
Traders should now pay close attention to immediate resistance at $0.006930, which is seen as the trigger level for further upward movement.
If $PENGU can break and hold above this level, it could push toward $0.0075–$0.0079 in the short term.
On the downside, failure to maintain momentum may lead to a pullback toward $0.0052, representing a potential 22% correction.
The key support levels to watch in the near term include $0.00644, $0.00617, $0.00612, and $0.00586.
Looking at historical data, $0.00452 has acted as a strong short-term support.
On the upside, $0.00783 has historically been a key resistance level, with moves above it often opening the path to higher ranges.
The next resistance levels above that are $0.0115 and $0.0141, which could become relevant if the rally sustains.
This layered structure of support and resistance gives traders a clear framework for monitoring price action.
Pudgy Penguins price forecast
Overall, $PENGU is at a critical juncture.
Momentum is improving, and catalysts like real-world utility and consolidation phases could support a further rally, but dense overhead resistance means traders should be cautious and monitor how the token behaves around these pivotal levels.
Traders should keep a close eye on $0.006930 as the immediate breakout trigger.
Holding above this level could see momentum carry the price toward $0.0075–$0.0079 in the short term.
For the long-term traders, the main resistance levels to watch are at $0.00783, followed by $0.0115 and $0.0141.
These levels could become key targets if the token gains sustained traction from the current price.
If resistance proves too strong, the token may fall toward $0.0052, testing lower support levels.

 invezz.com