Solana enters a critical wedge squeeze as momentum builds, with a breakout set to define the next major directional move.
Solana ($SOL) has recovered some of its losses, reaching $82.07, and posting a strong 7.0% gain over the past 24 hours. The intraday chart shows $SOL gradually climbing from the $76–$77 range before staging a sharp breakout above $82, briefly touching the upper end of its daily range at $82.51.
After the breakout, the price action consolidated at $81, suggesting buyers are maintaining control near session highs. The 24-hour range spans from $76.10 to $82.51, highlighting significant upside expansion during the session.
Performance metrics show mixed trends across longer timeframes. While $SOL is up 0.4% over the past hour and 7.0% over 24 hours, it remains down 3.4% over the past 7 days. It is also down 33.0% over 30 days, and 41.8% over one year, reflecting broader corrective pressure.
The recent breakout above the $80 level could signal strengthening short-term momentum. However, sustained upside continuation will depend on whether $SOL can hold above this reclaimed psychological level and build higher support in the sessions ahead.
Where’s Solana Headed?
Despite the recent recovery, Solana’s price on the daily chart still sits well below its major moving averages. The 50-day SMA rests near $108.79, the 100-day SMA around $120.11, and the 200-day SMA close to $158.92, all trending downward and stacked bearishly above the current price.
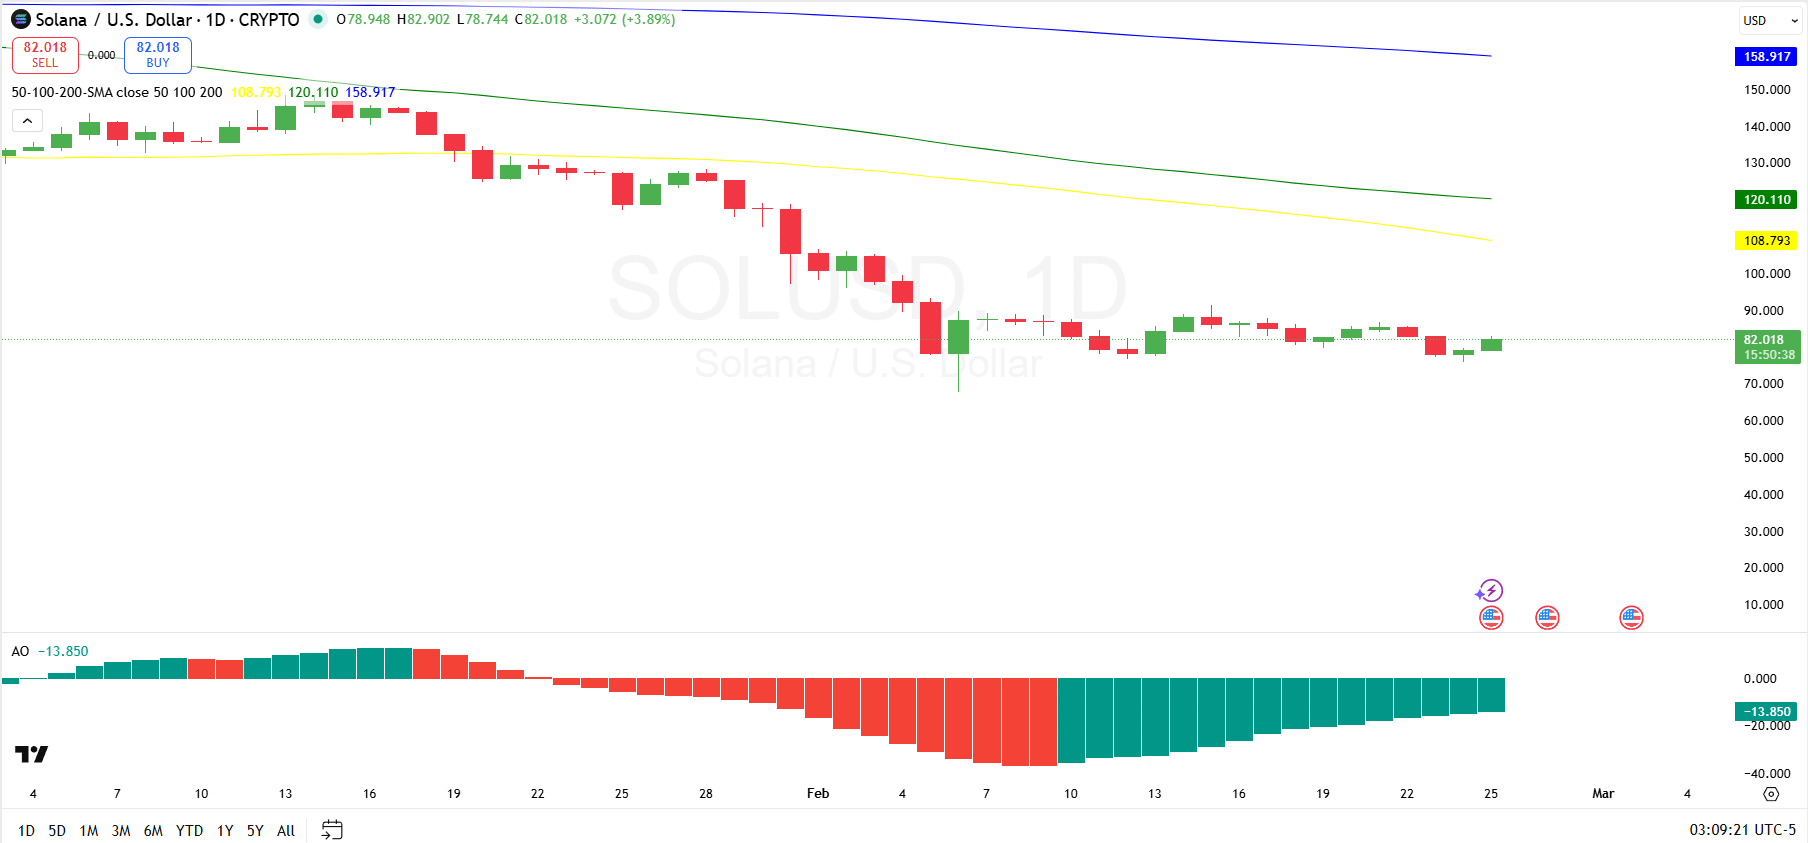
This alignment confirms that the broader trend remains negative despite recent stabilization. A sustained recovery would require a decisive move back above the 50-day SMA to shift the medium-term structure. If $SOL breaches the 50-day SMA, the next resistance level to watch will be $120.11.
Momentum indicators show early signs of improvement. For instance, the Awesome Oscillator remains below the zero line at approximately -13.85, indicating that bearish momentum is still present. However, the histogram bars have transitioned from deeper red to green, signaling that selling pressure is weakening and bullish momentum is gradually building.
While this shift suggests the potential for a short-term rebound, confirmation of a trend reversal would depend on $SOL reclaiming key moving averages and pushing the AO back into positive territory.
Solana’s Make or Break Zone?
On the commentary side, analyst account Whale Factor notes that Solana is entering what he describes as a high-probability “make or break” zone on the 4-hour timeframe. According to his analysis, $SOL is trading within a descending wedge pattern that is approaching maximum compression, signaling a potential volatility expansion at what he calls the “Critical Point.” This squeeze suggests that a decisive breakout could soon determine the next directional move.

In his bullish scenario, a clean breakout above the wedge followed by a successful retest of the $82 level could pave the way for a rally toward the $97–$100 macro resistance zone.
Conversely, if $SOL fails to hold the $78 support level, he warns that downside pressure could intensify, opening the door for a move back toward the $68 region. Whale Factor emphasizes that traders should manage risk carefully, as the trend will only confirm itself once a clear breakout occurs.