$XRP is on track to close its fifth consecutive red monthly candle for the first time since 2016–2017.
Some analysts believe this rare stretch could mirror one of the biggest rallies in crypto history.
At the time of writing, $XRP trades at $1.36, up 2.25% on the day but still down around 8% on the weekly timeframe.
Key Points
- $XRP is set to close five straight red months for the first time since 2016–2017, a rare historical signal.
- In 2017, a similar five-month slump preceded a massive 60,000% rally to new all-time highs.
- A repeat 60,000% surge from $1.36 would imply a theoretical price in triple digits for $XRP.
- However, today’s larger market cap makes another exponential rally far more difficult.
Rare Pattern Returns
Widely followed $XRP commentator Caesar noted that it took five red months in 2016 to “shake out every weak hand” before the asset exploded higher. At the time, $XRP was trading with two zeros at around $0.005. What followed was historic.
After printing five consecutive red monthly candles between October 2016 and February 2017, $XRP went on to rally approximately 60,000% into January 2018. Specifically, the price moved from $0.005 to above $3.30, turning modest sums into massive gains.
History Repeating
Now, since $XRP touched $3.66 in July, it has been in a bearish phase. In particular, $XRP has posted negative monthly returns for five consecutive months since October 2025, recording monthly losses of 11.9%, 13.8%, 14.8%, 10.6%, and a 17% decline so far in February 2026.
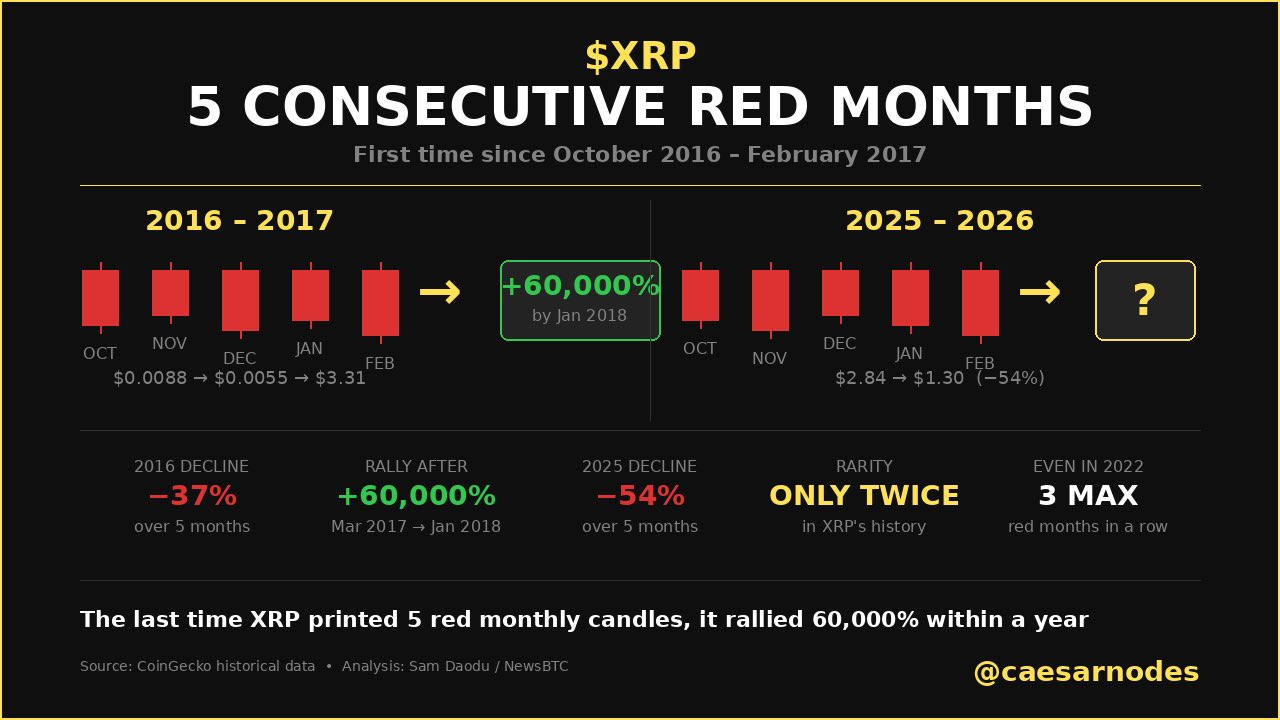
Technical analyst ChartNerd also highlighted that this is the first time $XRP has printed five red monthly candles since the 2016–2017 period.
Historically, even during the 2022 bear market, $XRP saw a maximum of three consecutive red monthly candles, making the current five-month stretch statistically unusual.
This has sparked optimism that another rally similar to the 2016–2017 surge could unfold. Some commentators are already speculating about the possibility of another 60,000% move.
What Would a 60,000% Surge Mean for $XRP Today?
A 60,000% increase equals a 600x move. If $XRP were to replicate that magnitude from today’s price of $1.36, the hypothetical target would be $816.
An $XRP price of $816 would imply a market capitalization of approximately $50 trillion under current supply levels.
For perspective, gold has a market capitalization of about $36.2 trillion, while silver trails far behind at $5.09 trillion. Major tech companies like NVIDIA, Apple, Google, and Microsoft have a combined valuation of around $15 trillion.
In other words, if $XRP were to repeat its 2017 performance, its hypothetical market cap would surpass the entire precious metals and major technology sectors.
Notably, $XRP has already delivered a major rally in the recent cycle. It surged roughly 600%, climbing from $0.49 in November 2024 to $3.66 in July 2025. That move demonstrated how quickly sentiment can shift when momentum returns.
Is History Repeating or Just Rhyming?
While the five-red-month pattern is historically significant, market conditions today are very different from those in 2016. $XRP is now a large-cap asset with global exchange listings, institutional visibility, and greater regulatory clarity compared to its early years.
In 2016, $XRP’s market capitalization was relatively small, around $200 million to $300 million, making parabolic percentage gains easier. Today, its market cap stands at approximately $83.3 billion.
Still, supporters argue that extreme pessimism and prolonged monthly declines have historically marked major turning points. Critics counter that percentage comparisons from sub-cent price levels may not translate cleanly into today’s market structure.
Ultimately, five consecutive red months are rare in $XRP’s history, and markets are watching closely to see what comes next.