Amid persisting price weakness, technical indicators have analyzed price momentum and suggested what could follow for Shiba Inu.
This technical analysis includes key data from price momentum indicators, such as oscillators and moving averages. They provide insight into the real state of things on different time frames, highlighting whether it is the best time to buy or sell.
Key Points
- Technical indicators, including momentum oscillators and moving averages, have analyzed Shiba Inu price action and determined what could follow.
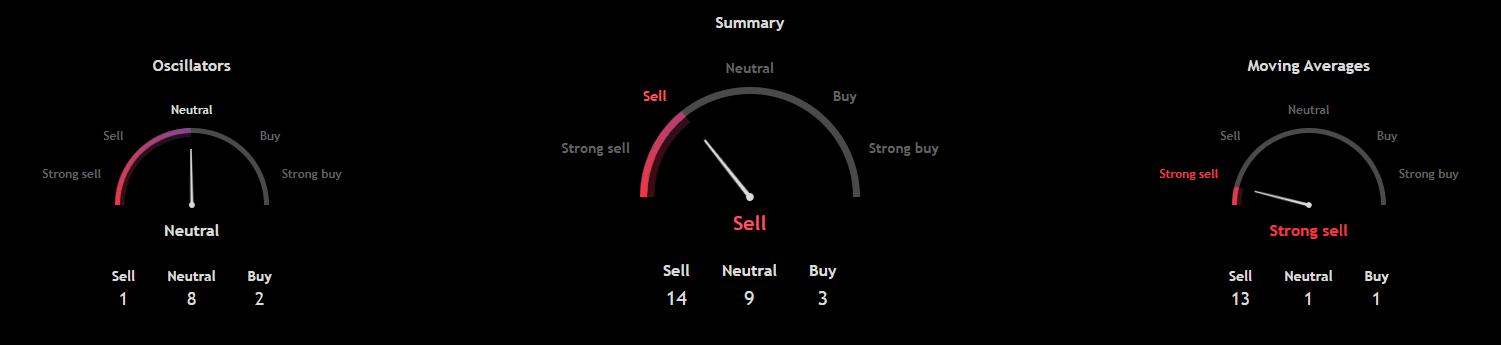
- Of 15 moving averages analyzed, 13 are flashing strong sell signals, one is neutral, and one suggests buying $SHIB.
- Technical oscillators produce a softer signal, with 8 neutral, 2 buy, and 1 sell signals.
- In summary, the verdict is a sell signal. With 14 sell, 9 neutral, and 3 buy signals, the majority is skewed towards further price capitulation.
- Adding to the bearish context is the rise in selling pressure on exchanges over the past 24 hours.
Shiba Inu Price Struggles
While volatility appeared to be cooling and the crypto market was stabilizing, macro uncertainties stemming from Donald Trump’s new tariff policy kicked in again, sparking a sharp decline.
With Bitcoin briefly falling below $63,000, Shiba Inu followed suit. The prominent meme coin fell 2.75% on Monday and is already down 1.66% in the early hours of today. The move has seen it continue to cut back on an earlier recovery push to $0.00000725 on February 14. At the current market price of $0.00000593, $SHIB has dropped 18% from the high.
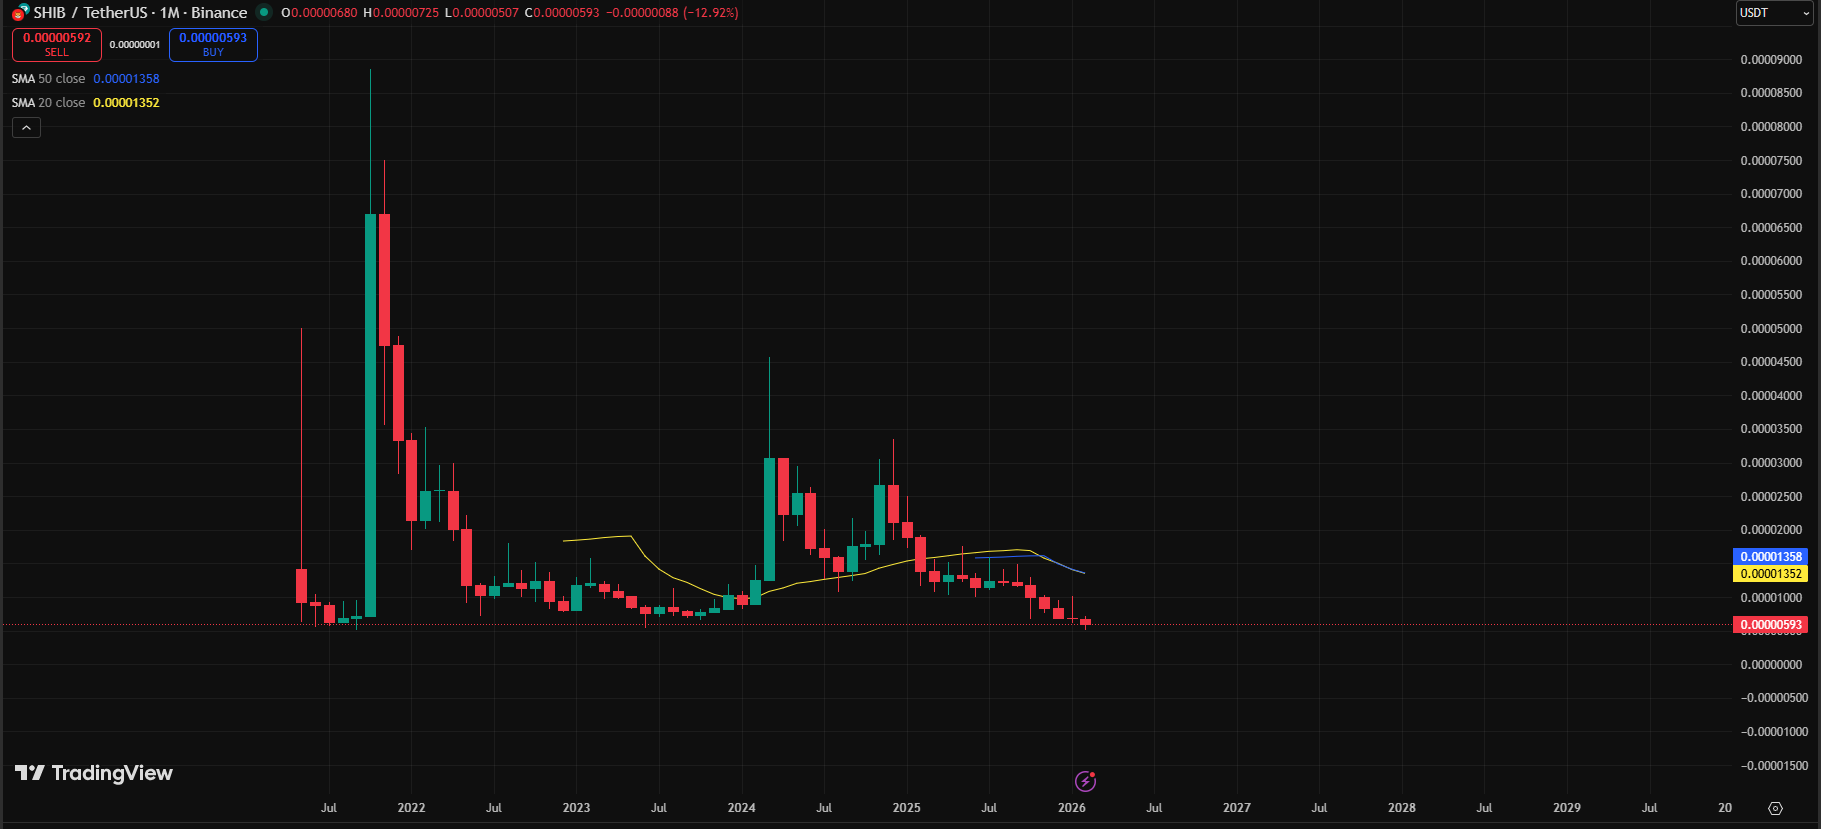
If things remain as they are now, Shiba Inu would be posting its seventh consecutive monthly red candlestick. This reinforces the bears’ total domination since August 2025, who have now dragged the asset down 58% from the high of $0.00001419 that month.
Shiba Inu Technical Indicators
Weekly technical indicator data from TradingView reflects this bearish state, but more critical is their outlook on the Shiba Inu price.
For context, of 15 moving averages analyzed, 13 are flashing strong sell signals, with one neutral and one suggesting buying $SHIB. Notably, this is a very convincing bearish stance, suggesting the market is not ready for any upside move at the moment. Recall that the token is trending below all major exponential and simple moving averages, a clear sign of a lack of upside momentum.
However, technical oscillators have a softer signal. These indicators are neutral, as most individual oscillators are signaling uncertainty over the next price action for $SHIB. The momentum (10) and Stochastic RSI fast oscillators are flashing buy signals, and the MACD says buy, while 8 others remain neutral.
In summary, the verdict is a sell signal. With 14 sell, 9 neutral, and 3 buy signals, the majority is skewed towards further price capitulation.
Exchange Data Shows More Selling Pressure
Adding to the bearish context is the rise in selling pressure on exchanges over the past 24 hours. During this timeframe, the $SHIB exchange reserve rose from 81.397 trillion to 81.418 trillion, as holders appear to be increasingly moving their stash to trading platforms.
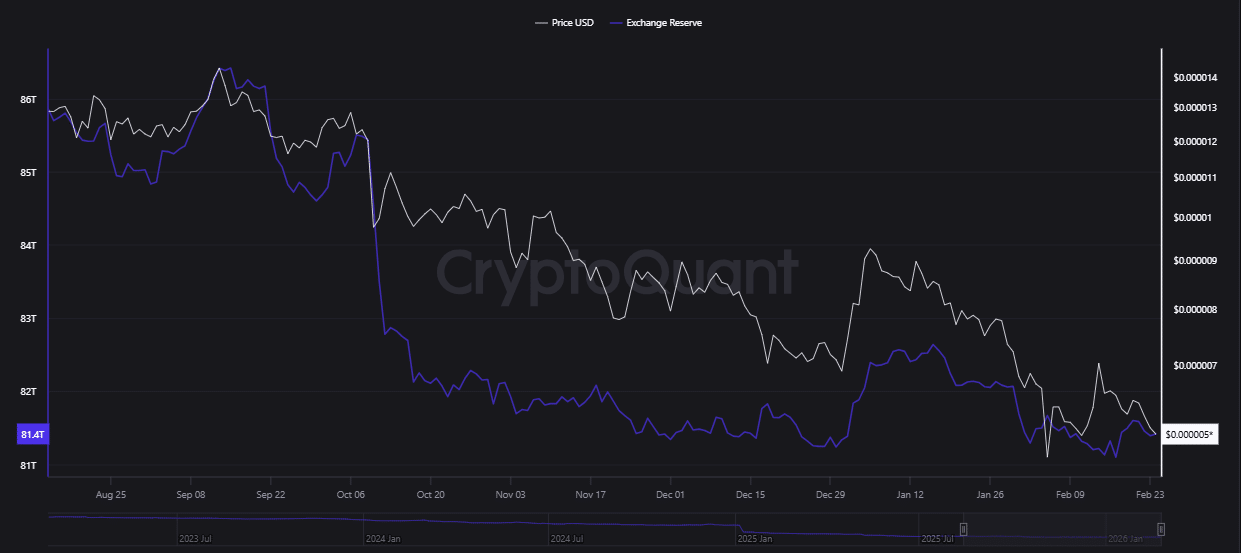
Notably, such a move suggests a distribution over accumulation disposition, bringing extended selling pressure on the meme coin. While it does not automatically signal a sell, it makes it easy for holders to immediately dump their tokens at any uncomfortable market move.
Despite these, Shiba Inu sits around a crucial support level of around $0.0000050, and analysts suggest that as long as it holds, there is still hope of a price recovery.