TL;DR
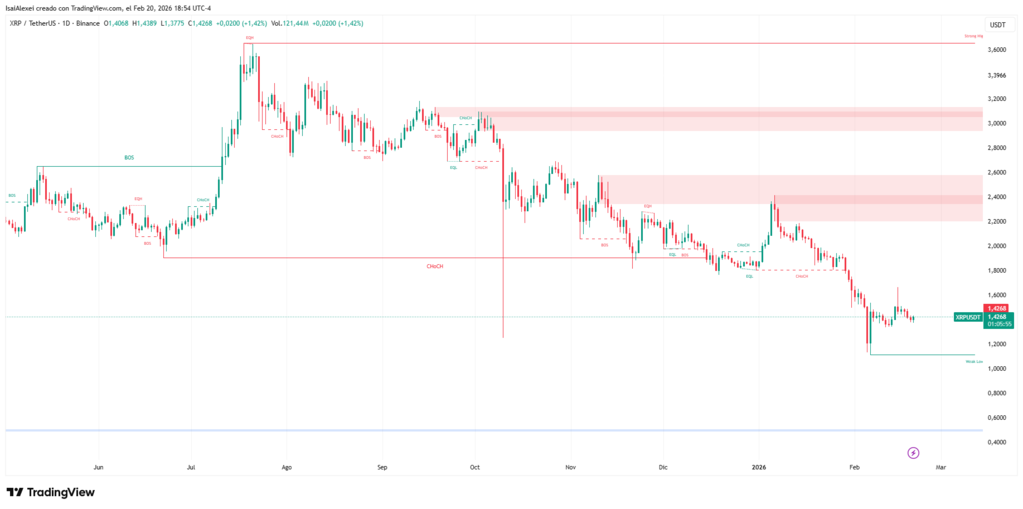
- $XRP corrects over 40% from January highs, trading near $1.40.
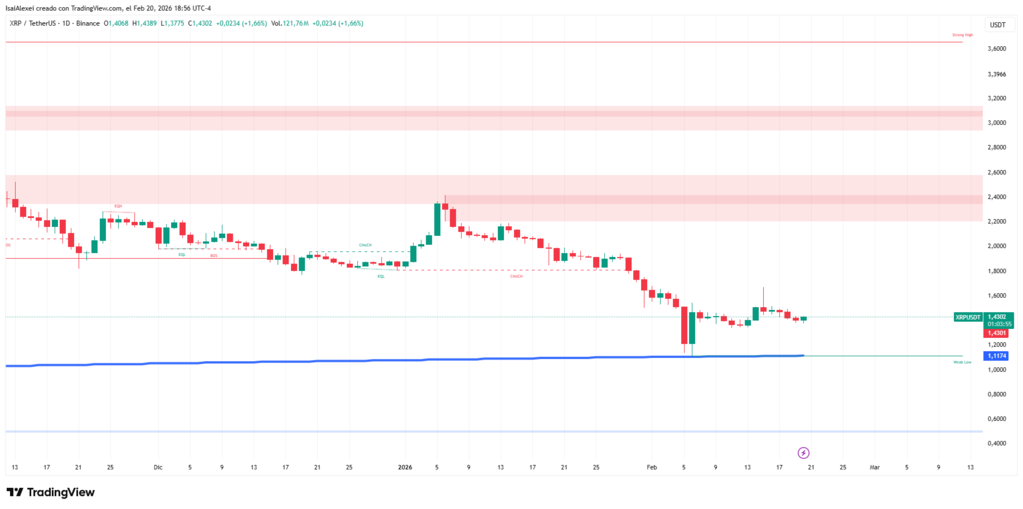
- The 200-week moving average and 50% Fibonacci level support the bull thesis.
- Standard Chartered cuts its year-end forecast from $8 to $2.80.
The $XRP market faces a technical dichotomy: macro indicators support a long-term uptrend, while the price undergoes a deep correction exceeding 40% from January highs. $XRP currently trades in the range of $1.39 to $1.43, far from the $2.40 reached weeks ago. The question among investors and analysts is whether the global bullish structure remains intact or if the asset entered a prolonged bearish phase.
Proponents of the bullish thesis point to several technical elements showing no signs of deterioration. The price did not close below key supports in higher timeframes, a necessary condition to invalidate the main trend. The 200-week moving average, a reference indicator for measuring long-term trends, remains firmly below the current price, reinforcing the idea that the corrective movement falls within a broader bullish context.
Crypto Economy analysts interpret the drop as a fourth-wave correction within a five-wave impulse. The retracement reached the 50% Fibonacci level, a common turning point in healthy corrections. Additionally, $XRP shows a five-wave micro-structure at recent lows, a behavior that contrasts with most altcoins, whose charts present three-wave corrective structures. That relative strength suggests the asset could lead the next market recovery.
The short-term outlook presents contradictory signals that fuel caution
Standard Chartered drastically reduced its projection for $XRP by the end of 2026, from $8 to $2.80, an adjustment reflecting the need to moderate expectations after the initial rally. The institutional move indicates the market is incorporating a scenario of reduced euphoria in the coming months.
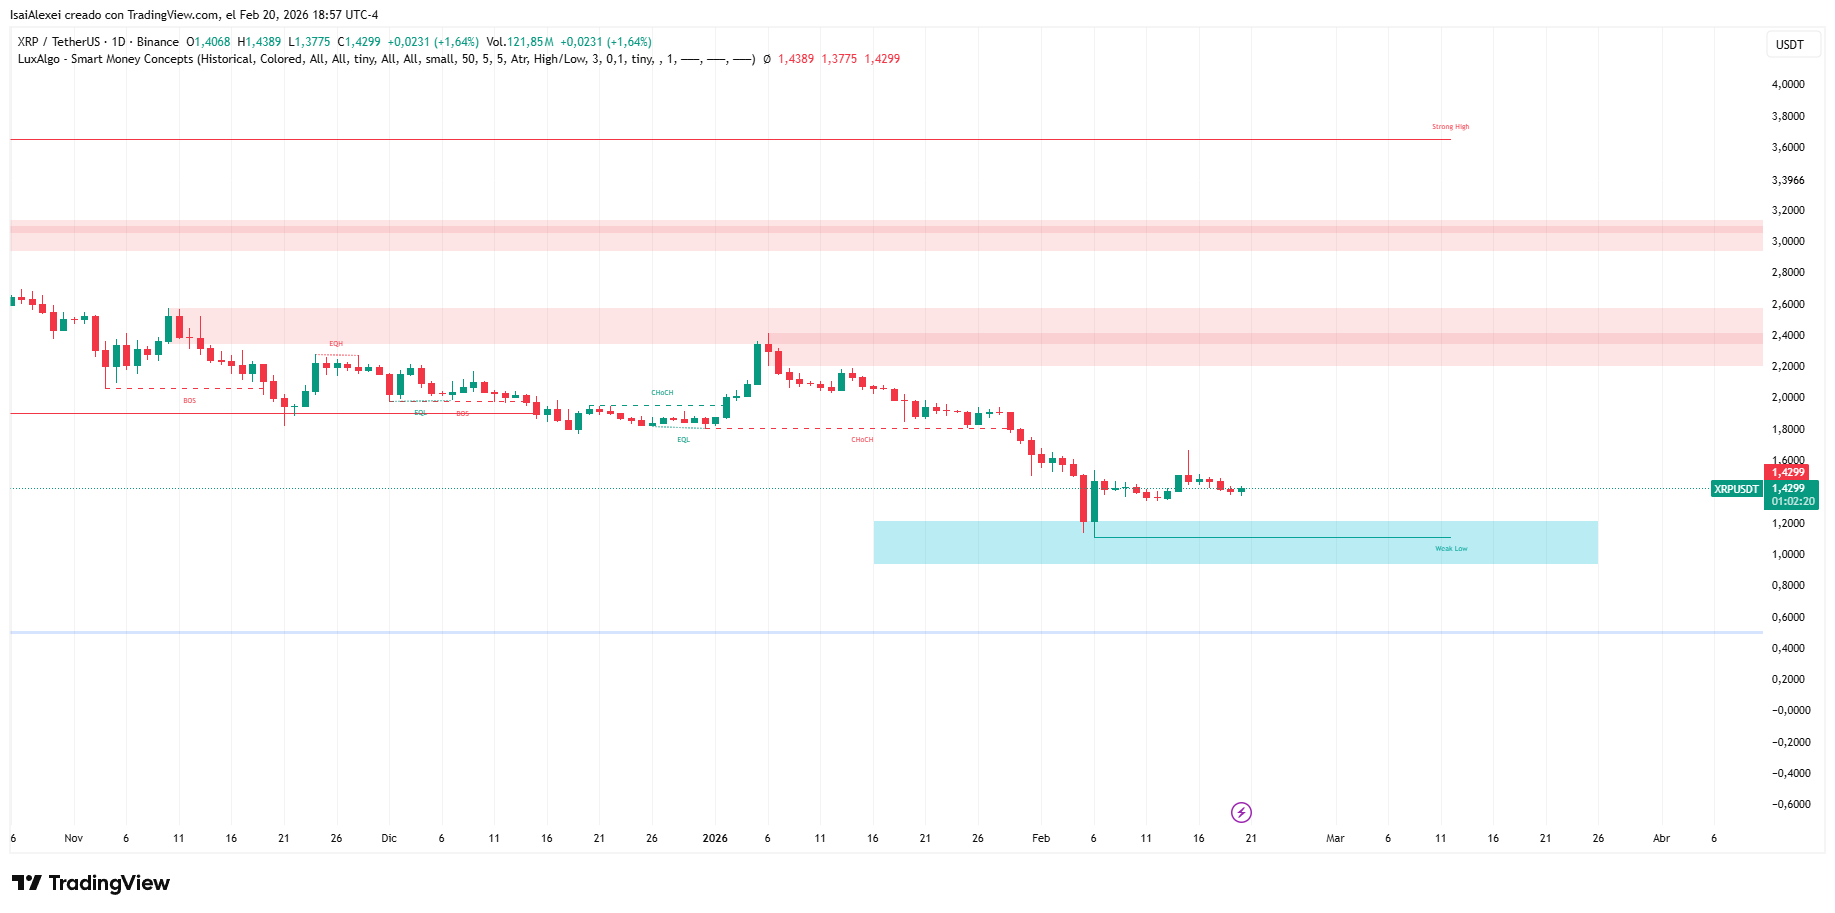
The daily chart shows $XRP trapped in a descending channel, with the price trading below several exponential moving averages that act as resistances. Some analysts warn that if selling pressure persists, the asset could seek support in the $1.00 zone, the channel’s lower boundary. The recent outflow of nearly 200 million tokens from exchanges, although interpreted by some as accumulation, failed to push the price above the key resistance of $1.50 to $1.60, reflecting insufficient demand to absorb supply.
The market awaits two immediate catalysts that will define the direction in the coming days. The release of the PCE index in the United States, scheduled for today, February 20, will act as an inflation thermometer and condition appetite for risk assets. A reading below expectations could push $XRP toward the $1.60 resistance. Data above forecasts would increase the probability of declines toward $1.35 or lower levels.
The $1.60 level consolidated as the dividing line between bearish and bullish scenarios. A clear break above that price with volume would enable a move toward $1.80 and eventually toward yearly highs at $2.40. Failure to overcome that barrier would keep the corrective structure in force.