u.today
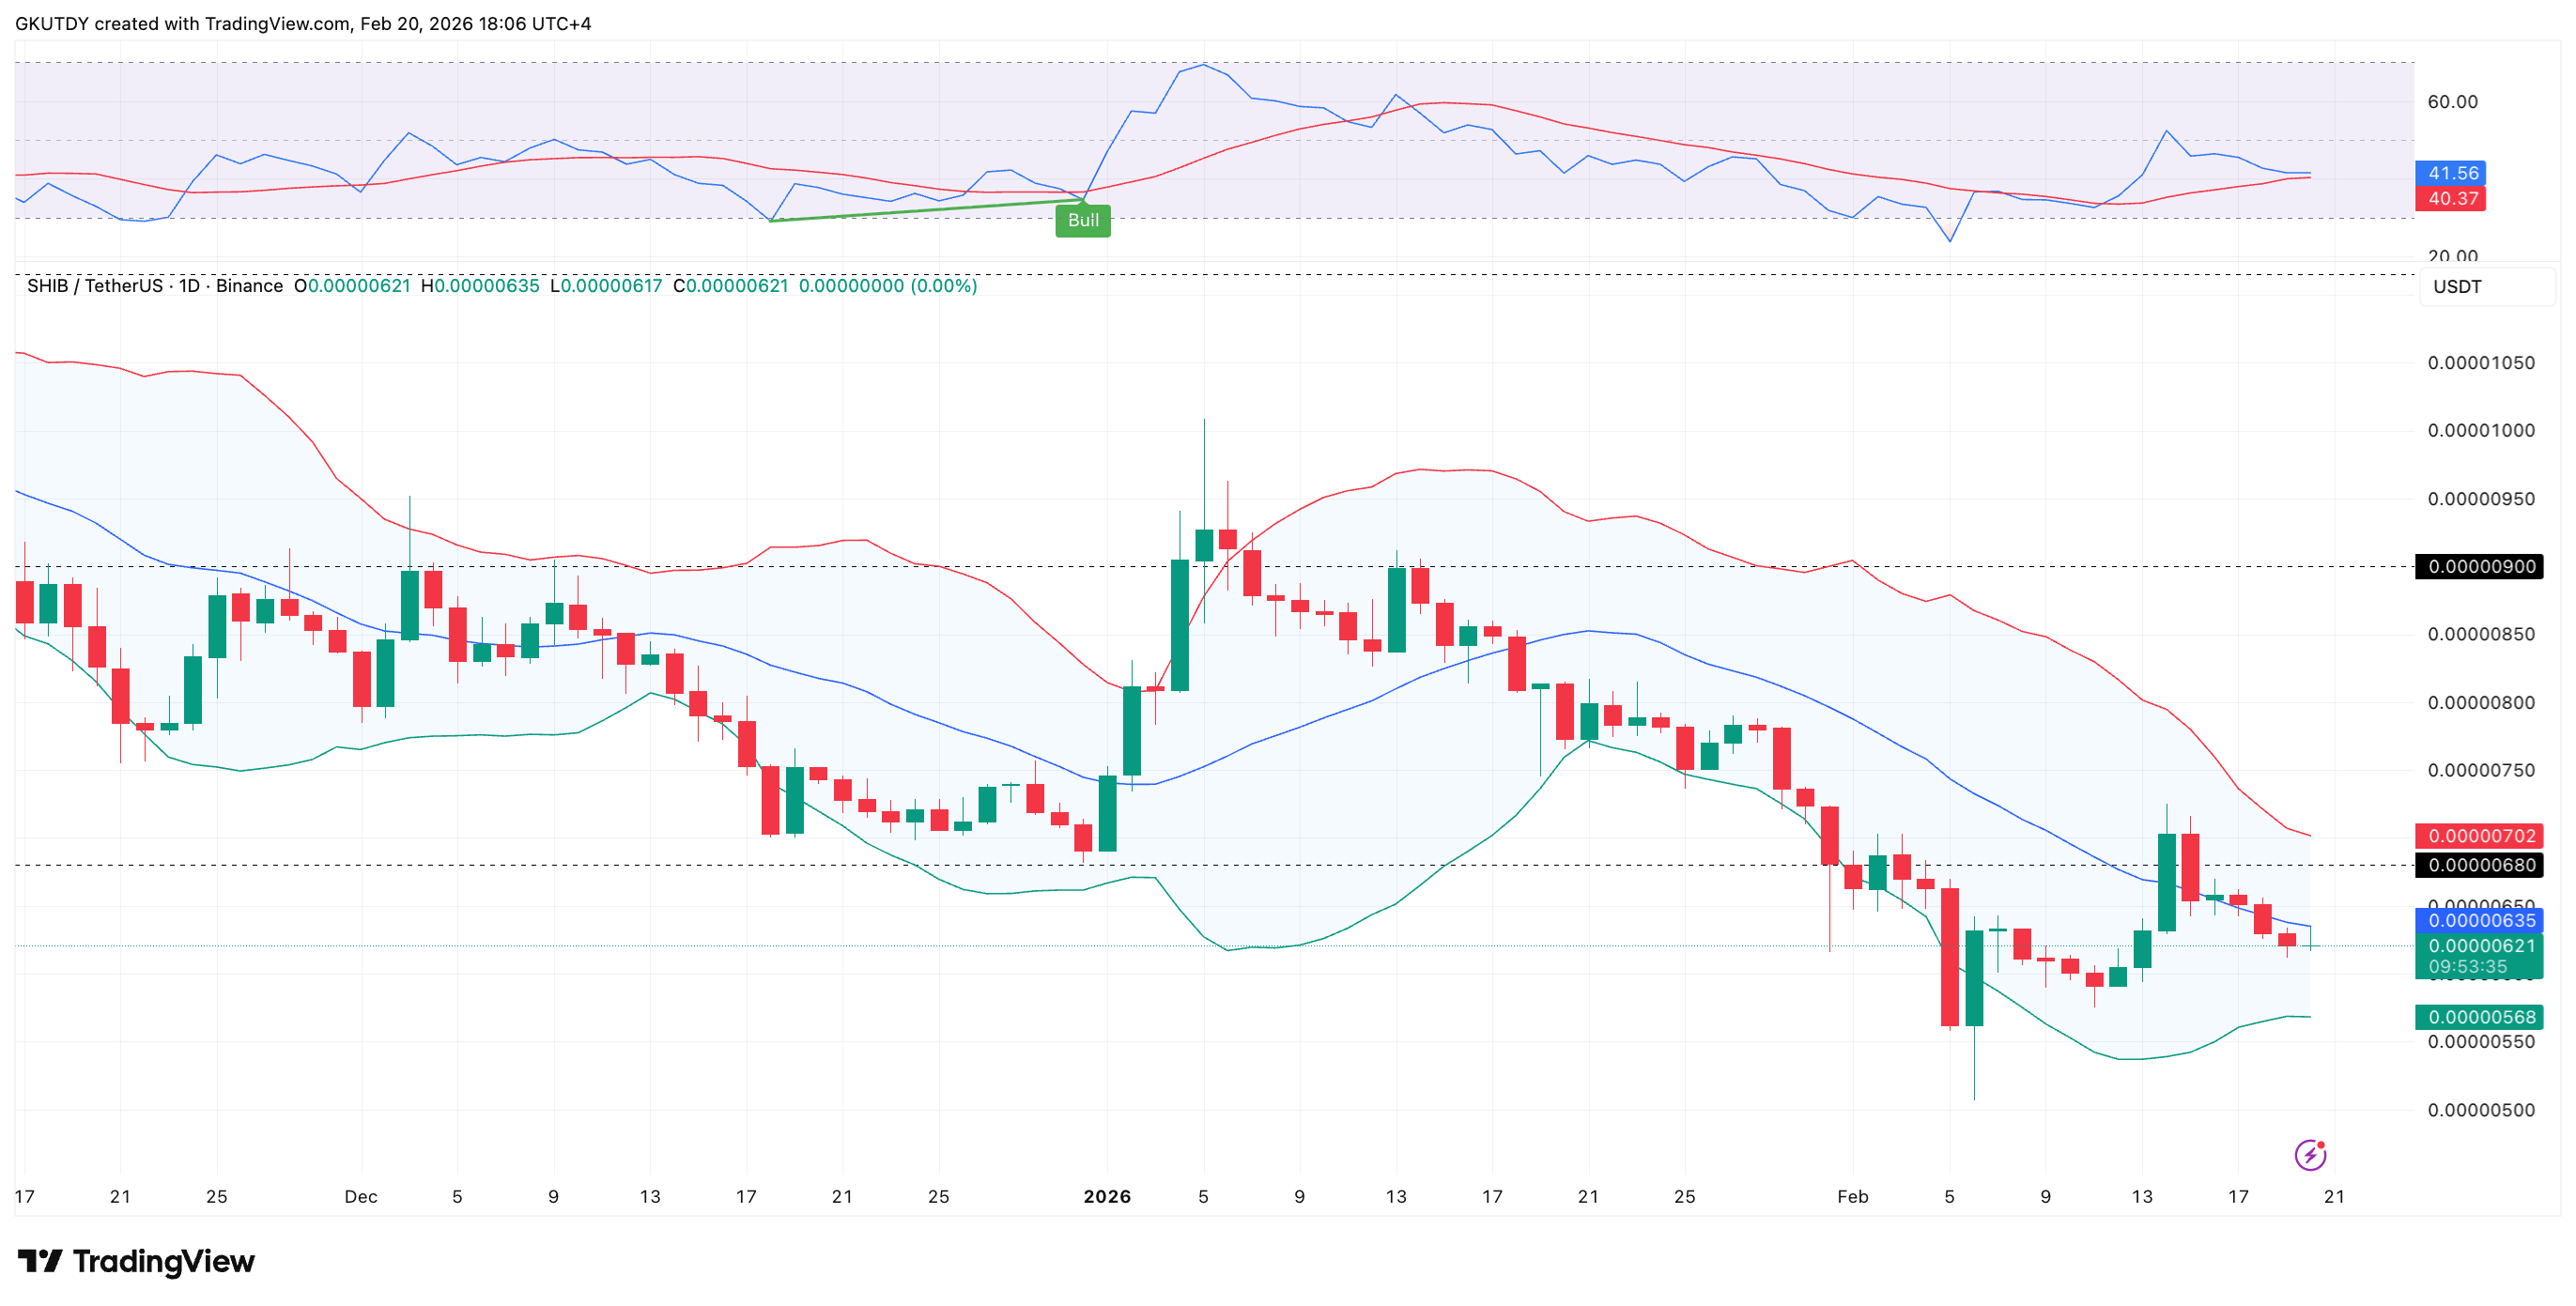
Shiba Inu ($SHIB) enters the weekend within striking distance of a key Bollinger Bands level, with the price of the coin now sitting about 2.65% below the midline of it midband, represented by the 20-day moving average — a threshold often associated with a transition from corrective structure to early recovery.
On the daily $SHIB/USDT chart by TradingView, the coin is changing hands near $0.00000626, while the 20-day simple moving average, which forms the basis of the Bollinger Bands, stands near $0.00000635. A confirmed close above that zone would position $SHIB back inside the upper half of the bands — the one the coin lost this week after a 3.23% sell-off.
Identifying $SHIB’s recovery targets and downside risks
Since early January, $SHIB has trended lower from the $0.000009 region, printing a sequence of lower highs and lower lows. The lower Bollinger Band recently compressed near $0.0000056, where buyers stepped in, producing a bounce that briefly pushed the price toward $0.000007. That rebound stalled, but the token has not revisited its February low, suggesting supply may be thinning at the margin.