$XRP has repeated the more than 60% price crash it witnessed in 2017, but historical data suggests what follows is a massive upsurge.
The $XRP price has struggled over the past five months, recording steep declines alongside the rest of the crypto market. Amid the downtrend, $XRP dropped to a floor price of $1.11 on Feb. 6, marking a 15-month low. Notably, this marked a 65% decline from the $3.4 high in January 2025.
Interestingly, market data now indicates that this 65% crash mirrored a similar 68% drop for the $XRP price during the 2017/2018 cycle. However, what followed that drop was a 1,300% increase to $3.31 by January 2018. If $XRP replicates the same response, its price could rebound to $18.
Key Points
- $XRP has surrendered to the demands of the bears over the past five months, eventually dropping to $1.11 on Feb. 6 before recovering to $1.48.
- The decline to $1.11 represented a 65% crash from the January 2025 high of $3.4, and marked one of $XRP’s largest losses in recent years.
- Market data now confirms that this recent crash mirrored a similar 68% drop recorded by $XRP during the 2017/2018 bull cycle.
- Interestingly, following the 68% drop in 2017, $XRP recovered after a few months, mounting a 1,300% rise to $3.31 by January 2018.
- If $XRP continues to flow the 2017/2018 pattern, the next rebound effort could trigger similar gains, possibly pushing prices to $18.
$XRP Following a Wave-like Pattern
This context was presented by CryptoBull, a prominent market analyst, as the market struggles to find a bottom. According to CryptoBull, $XRP’s ongoing downtrend appears to be following a Wave-like structure, which began in November 2024.
Specifically, CryptoBull pointed out that Wave 1 played out when $XRP soared from the $0.5 level in November 2024 to the high of $3.4 by January 2025 following Donald Trump’s victory in the U.S. election. This represented a 580% increase within three months and marked the end of Wave 1.
Meanwhile, Wave 2 began immediately as a pullback from the $3.4 high ensued. $XRP spent most of 2025 battling this corrective phase, as Wave 2 extended for months. This wave has now slipped into the new year, with the downtrend pushing prices to $1.11 by Feb. 6. Notably, this low represented a 68% drop from the $3.4 high.
History Repeating?
As multiple analysts believe the ongoing downtrend may be nearing its end, CryptoBull expects the subsequent recovery push to take prices to $13. However, historical data suggests this rebound could actually go as high as $18, surpassing the $13 target. Specifically, data shows that $XRP followed a similar Wave-like structure in the 2017/2018 cycle.
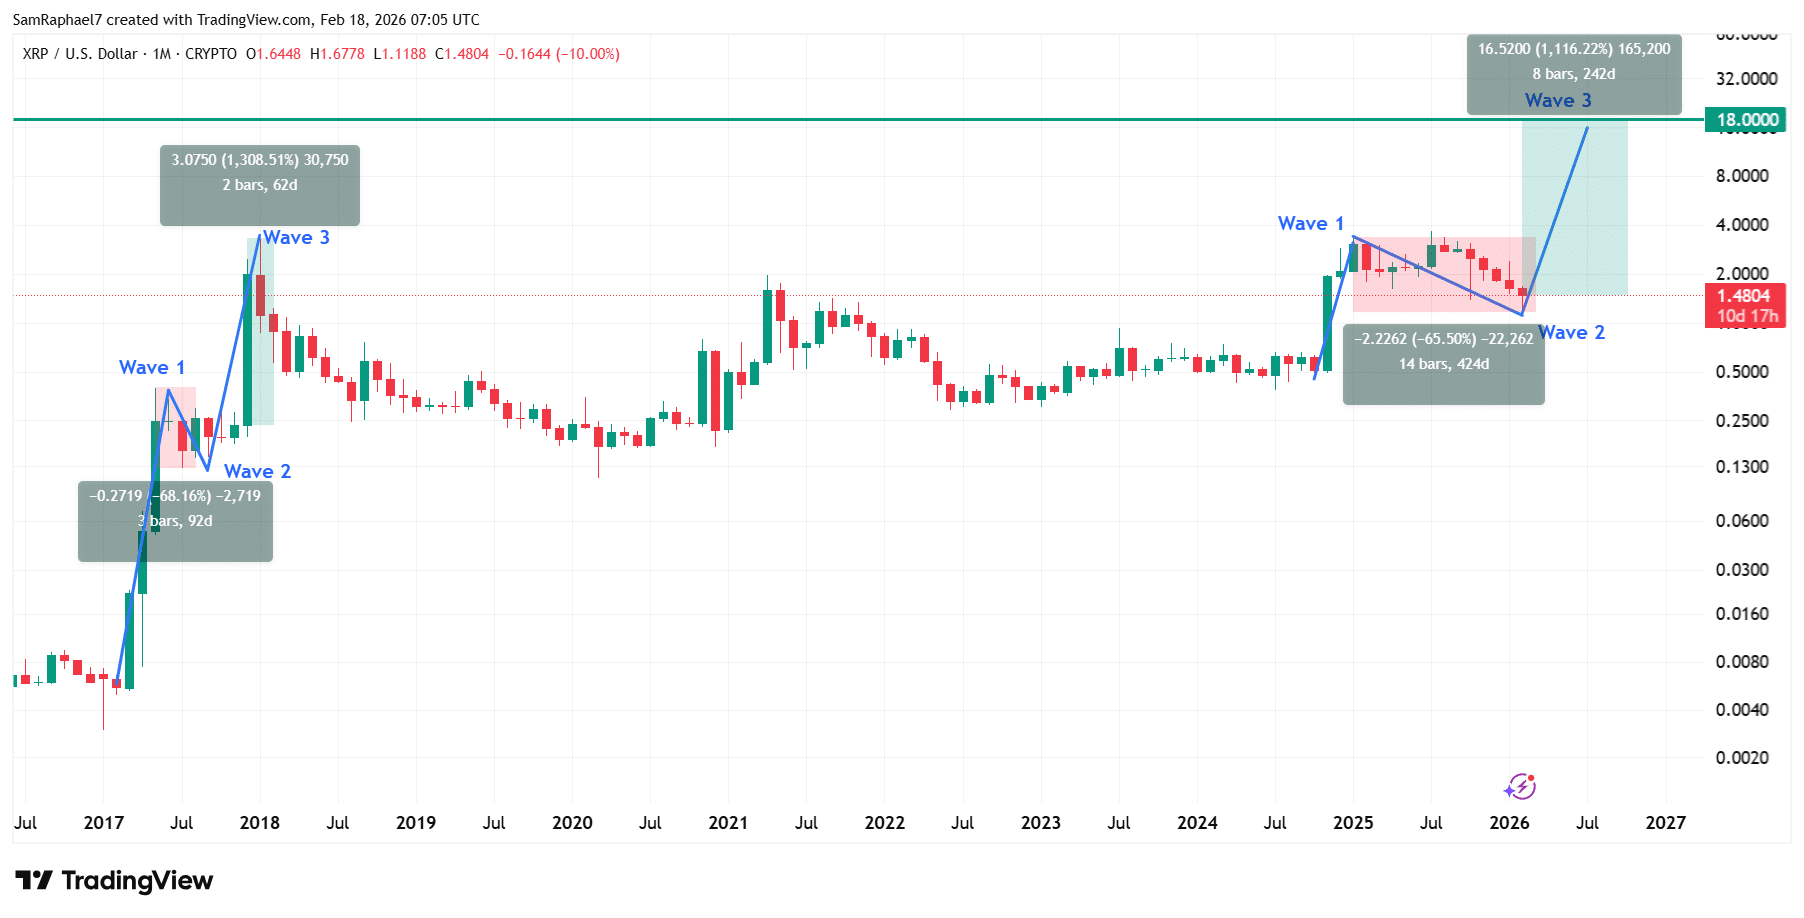
During this period, Wave 1 played out when $XRP recovered from $0.005 to $0.3989 by May 2017. After this, Wave 2 brought a correction that lasted for six months, with $XRP hitting a bottom of $0.1270 during the correction. Interestingly, this floor price represented a 68% decline from the $0.3989 high in May 2017, similar to the 65% decline in this cycle.
What followed after the Wave 2 correction in 2017 was a massive upsurge as a rebound effort emerged alongside Wave 3. This Wave 3 took prices to a peak of $3.31 by January 2018, representing a 1,300% increase from the $0.2350 price at the time the Wave 3 recovery began.
Could $XRP Claim $18?
CryptoBull believes this cycle’s Wave 3 could deliver similar gains. While he suggested that $XRP saw a 1,200% rise in 2017/2018 and may rise to $13, the upsurge was actually much higher, at 1,300%. Even if $XRP replicated the 1,200% increase, prices could rise from current levels to the $18 mark.
However, it is important to note that previous successes do not guarantee future results. $XRP’s prospects may look good at press time, but there is no guarantee that the $1.11 low marked the bottom. Also, the extent of $XRP’s recovery from this downtrend remains uncertain.