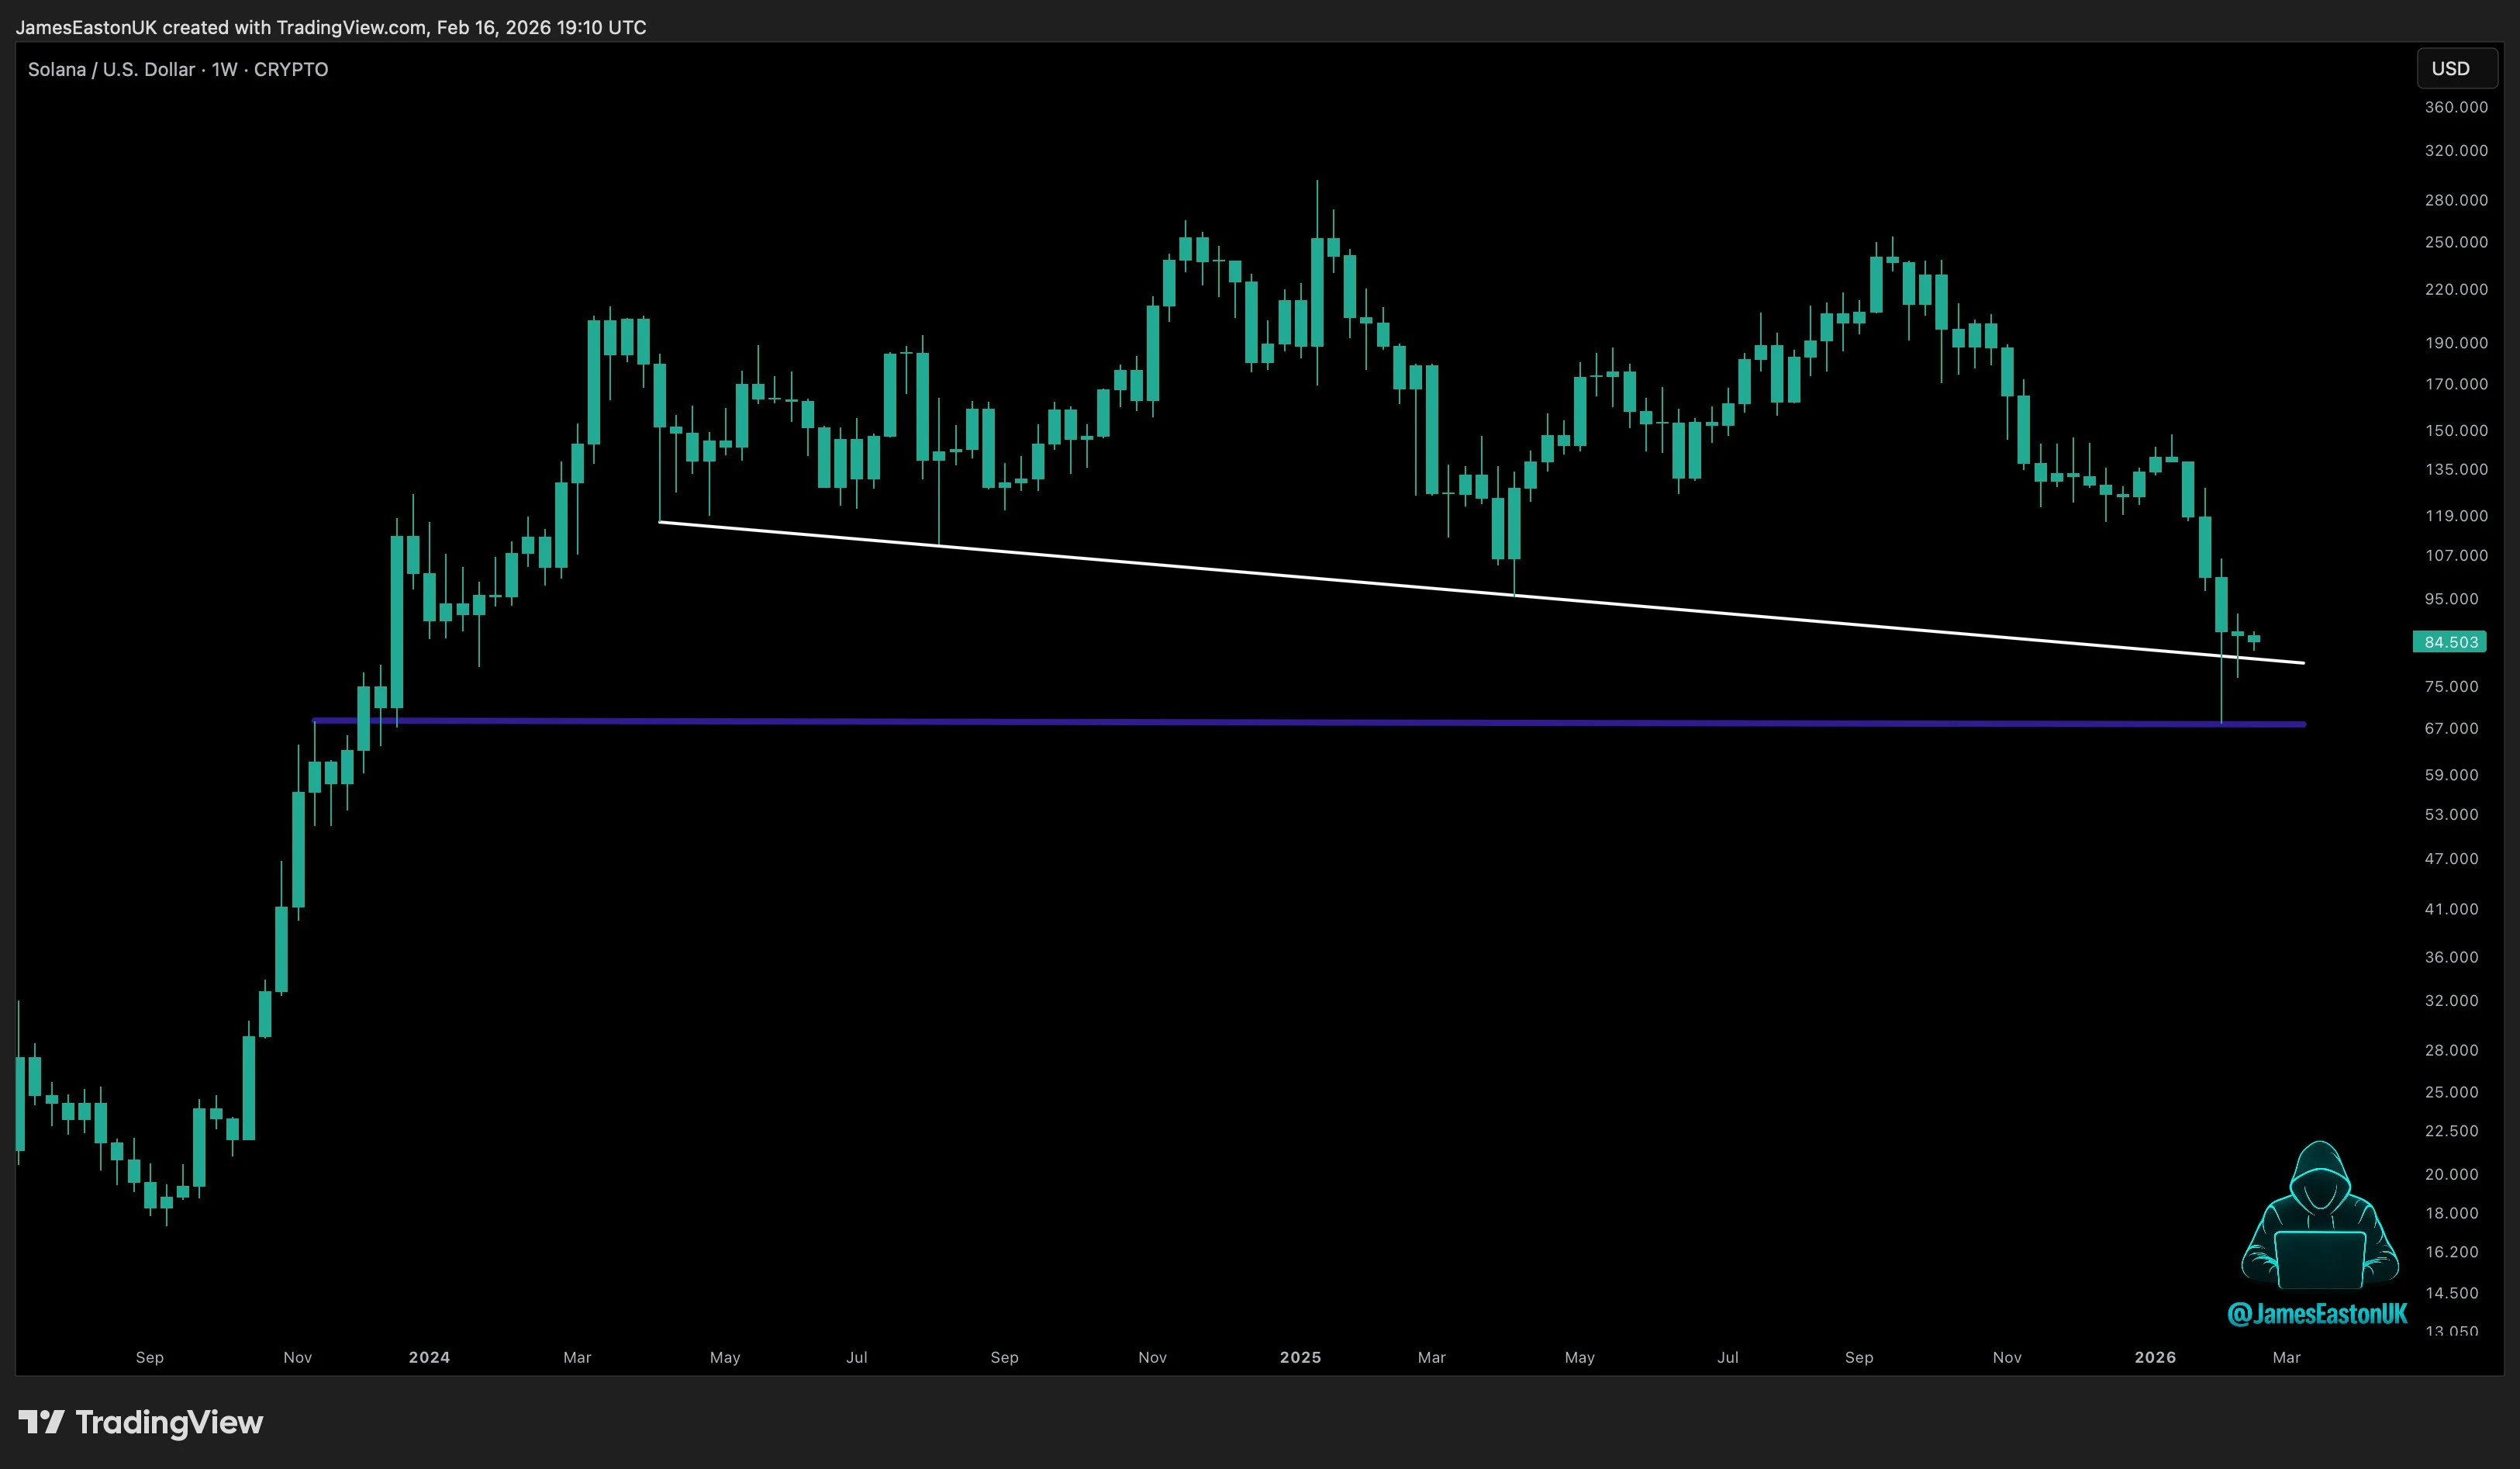
Consequently, reclaiming the prior wave (1) high between $89 and $90 would confirm renewed strength. A decisive move above that zone could open the path toward $97 and possibly $100.89. However, failure to hold $83 would likely extend consolidation.
Macro Structure Remains Below $120 Ceiling
Crypto_Scient maintains a cautious macro stance. The weekly chart shows Solana trading below the former $120 support, which now acts as resistance. Hence, rallies remain corrective until that ceiling breaks.
The analyst identifies two major downside zones. First, the 0.75 Fibonacci pocket between $60 and $70 aligns with prior accumulation. Moreover, that range overlaps with historical demand.
Second, the weekly demand imbalance that fueled the rally from $25 to $200 stands as a deeper support base. Everything between these zones appears transitional noise.
Additionally, the market cap remains above $48 billion, supported by steady network participation. However, macro pressure persists while price trades under $120.
Long-Term Conviction Versus Short-Term Pressure
James takes a broader perspective. He argues that if Solana eventually approaches $1000, current prices below $90 may look like strategic accumulation. Nevertheless, the weekly chart shows clear resistance at $90, $105, and $120.
Source: X
Consequently, bulls must defend the $67–$70 region to preserve higher-timeframe structure. A clean bounce there could form a durable base. Besides, a recovery above $100 would improve sentiment and attract sidelined capital.

 coinpaper.com