
- $XRP rejected the $1.67–$1.63 zone and now tests critical support as momentum eases again.
- A tightening wedge and rising exchange inflows place added pressure on short-term trends.
- Reclaiming the resistance band would mark a shift, though current bias still leans bearish.
$XRP’s latest rebound attempt fizzled almost as quickly as it formed, leaving traders once again questioning whether the downtrend has more room to run. The token’s weekend climb into the familiar $1.67–$1.63 pocket met firm resistance, a level that had capped the prior relief bounce and, once again, stopped momentum in its tracks.
The rejection did not spark panic selling, but it did shift attention back toward the support layers that have carried the market for weeks. By early Tuesday, $XRP hovered near $1.47, managing a modest 1.26% daily gain and a weekly rise of 4%.
The modest boosts were noticeable only because the wider market at +0.40% barely moved, and Bitcoin stayed flat with a slight 0.30% uptick. Moreover, flows favored altcoins slightly as the Altcoin Season Index edged up to 30, hinting at a mild rotation, while Bitcoin dominance eased toward 58.22%.
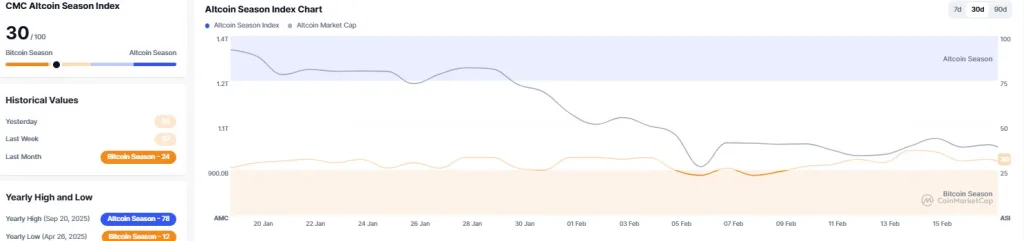
Source: CoinMarketCap
None of it formed a clear catalyst, but it did show pockets of demand resurfacing. Still, the numbers sit against a harsher backdrop: a 29% monthly slide and a 45% year-on-year decline. Those deeper losses continue to weigh heavily on sentiment.
$XRP Price Action: Resistance Holds, Trend Bends Lower Again
The push into $1.67–$1.63 never gathered the force needed to break through. Once the token’s price slipped back under $1.45, which lines up with the 38.20% Fibonacci marker, the tone changed. That area has acted as a pivot before, and losing it, even briefly, reintroduced the possibility of another swing lower.
Besides, according to the 1-hour chart TradingView analysis, the wave structure still leaves room for a retest of the $1.38–$1.34 band, where a potential double-bottom formation could occur. A deeper pocket near $1.14–$1.11 also sits below that, though calling it into play requires a clearer breakdown than anything seen over the past week.
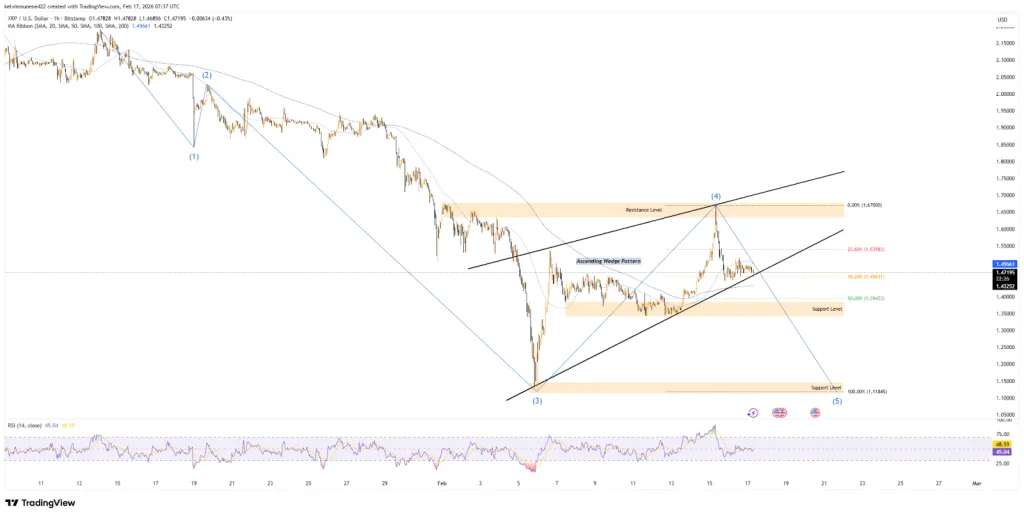
Source: TradingView
The RSI isn’t offering much comfort either. It slipped back to 45 after failing to push through the neutral 50 band, and the indicator has begun drifting lower again. That shift suggests sellers are regaining the upper hand, with room left for price to press lower before conditions turn oversold. A drop beneath the 40 region would make that bearish tone harder to ignore and could signal that momentum has fully tipped in favor of the downside.
Wedge Pattern Tightens as Pressure Builds
Not to leave out, $XRP has spent nearly two weeks moving inside a narrowing ascending wedge, usually a sign that a relief move is running out of steam. That structure now brings the coin’s price closer to the wedge’s lower rail, which happens to sit near the same $1.45 support cluster mentioned earlier.
A clean break beneath that line would weaken the case for any immediate stabilization and could guide $XRP’s price toward the 200-period moving average around $1.43. Regardless, the pattern doesn’t guarantee continuation, but it rarely resolves with a bullish outcome when it appears in the middle of a larger decline.
Exchange Flows and Sentiment Add Weight
On-chain positioning has also not helped the bullish case. Since the 14th, roughly $25 million worth of $XRP has moved into exchanges, an inflow that typically widens the supply available to sellers. It’s not an extraordinary figure, but it’s enough to register at a time when conviction remains uneven.
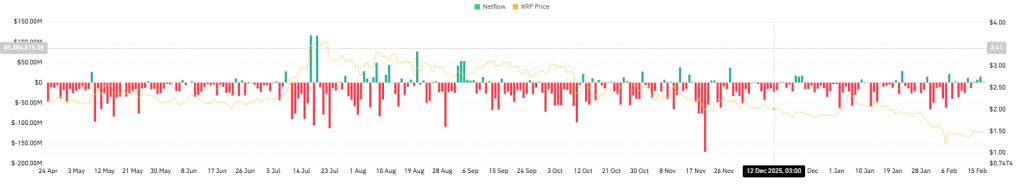
Source: CoinGlass
The sentiment picture grew heavier after Standard Chartered trimmed its year-end target from $8.00 to $2.80, a steep 65% reduction. The bank cited difficult market conditions, which aligned with broader risk-off behavior across several large-cap tokens.
Related: PIPPIN Price Soars 50% to $0.28: Can the Bull Run Break Higher?
Key Levels to Watch
The immediate focus now remains on whether $XRP can hold above wedge support near $1.45. A confirmed break below this area would align with the broader bearish continuation structure and expose lower support zones.
Conversely, a sustained reclaim and hold above $1.67–$1.63 would mark the first meaningful sign of structural strength. Such a move would reopen the path toward $1.80 and potentially $2.00.
For now, price action, momentum readings, exchange inflows, and long-term performance metrics collectively indicate that short-term downside risk remains elevated.
Disclaimer: The information provided by CryptoTale is for educational and informational purposes only and should not be considered financial advice. Always conduct your own research and consult with a professional before making any investment decisions. CryptoTale is not liable for any financial losses resulting from the use of the content.