Solana shows short-term bullish momentum but faces resistance around key areas. Can $SOL breach major breakout levels?
Solana ($SOL) is currently trading at $86.25, showing a 1.2% surge over the past 24 hours. The price has shown resilience after dipping to a low of $82.87 and reaching a high of $87.41, indicating moderate volatility during the day. This $4.54 daily price range between the lows and the highs shows the market’s active movement, with the price trending upwards as the day progressed, suggesting some bullish momentum.
In terms of trading volume, Solana has seen a 24-hour volume of $3.60 billion, down over 12%. On the other hand, the market cap is currently at $48.97 billion, up about 1.44%.
While Solana has shown positive performance in the short term, it is still down by 39.6% over the last 30 days and 53% over the past year. Traders will now be watching if Solana can sustain its upward momentum and break through key resistance levels.
Where’s Solana Headed?
On the daily chart, Solana is facing immediate resistance near the $91.69 level, as indicated by the middle band of the Bollinger Bands indicator. The price is currently moving towards this band, while the upper band is above at $114.65, indicating that the price is still well below its breakout levels.
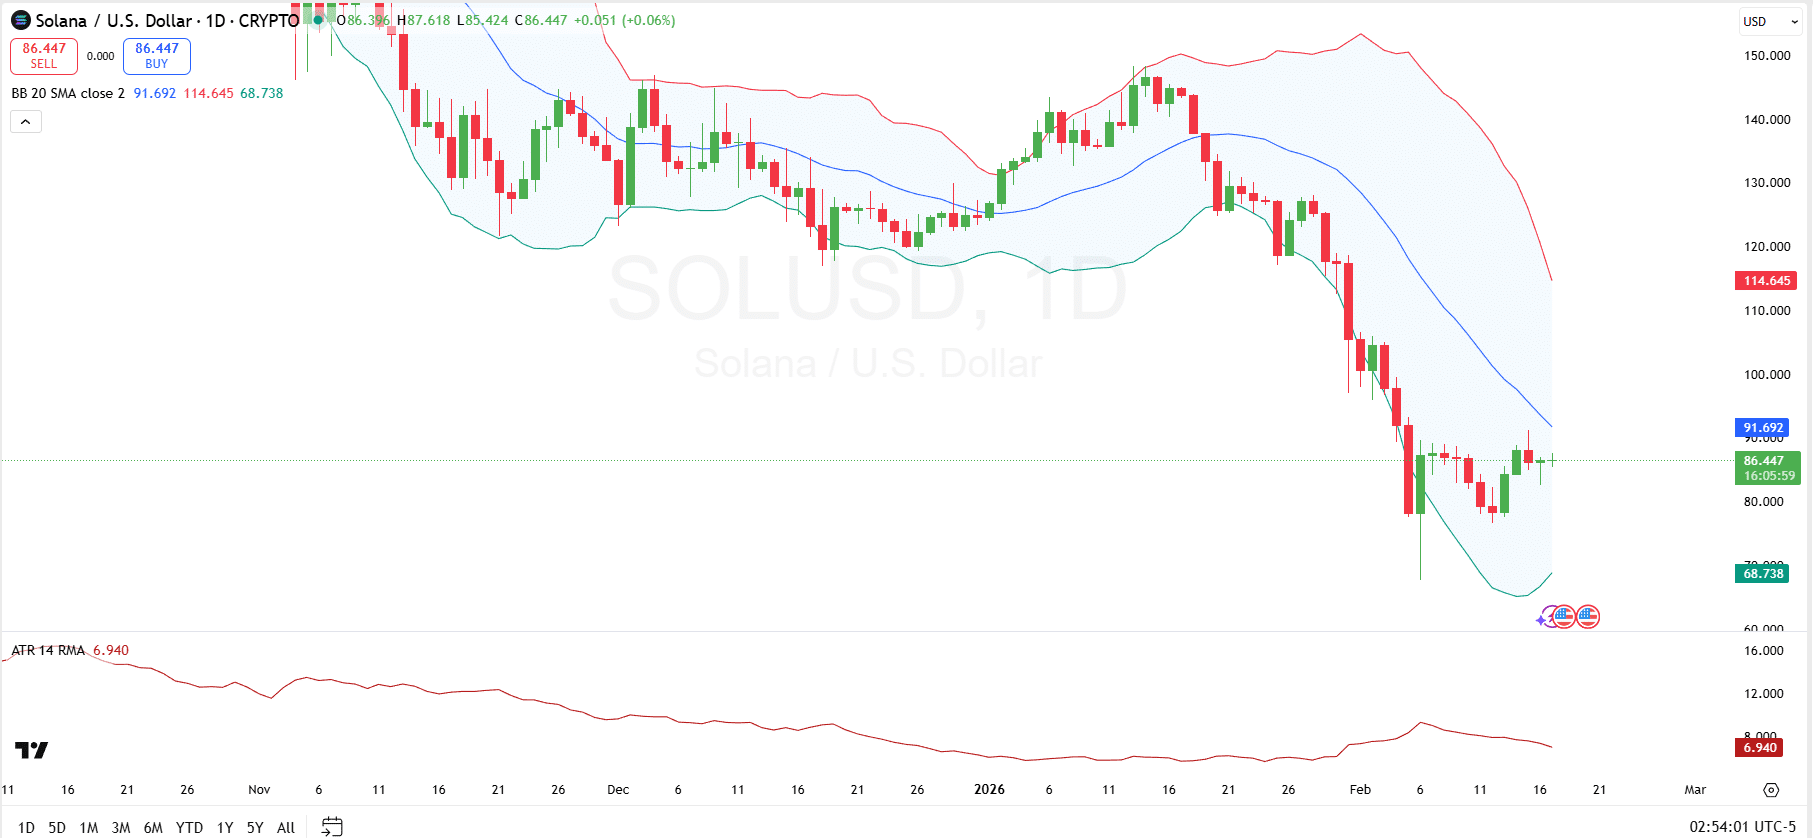
In terms of support, Solana has found a floor around $67.74, just above the lower Bollinger Band placed at $68.73. If Solana bears were to take over, they would need to break below the lower band first, then the next support level at $60.
The Average True Range, currently at 6.94, indicates low and declining volatility in comparison to earlier periods. The ATR level shows that the price won’t experience extreme fluctuations unless momentum shifts significantly. This would be either a breakout direction above $91.69 or a breakdown below $68.73.
Can Solana Reclaim $90?
Meanwhile, veteran trader BitGuru recently observed that Solana has been following a clear downtrend for weeks in the 4-hour timeframe, characterized by lower highs and lower lows. However, the market is now attempting a small rebound after holding a key support zone.
According to his commentary, $SOL is currently trying to reclaim the $90–$95 resistance area. This could be crucial for determining whether the price can continue to recover or if it will face further downside pressure.