
Shiba Inu shows a clear intraday decline followed by a modest recovery attempt. Price dropped from around $0.00000695 to near $0.00000645, showing strong selling pressure early. Buyers stepped in near the lows, forming a short-term base and pushing the price back toward $0.00000665. The rebound remains limited, suggesting cautious bullish momentum and ongoing consolidation below resistance. Currently, $SHIB is trading near $0.000006502, down about 1.38% over the past 24 hours.
$SHIB Faces Critical Resistance as Bulls Aim to Reclaim $0.0000067
The weekly chart by Ali Martinez highlights Shiba Inu testing the $0.0000067 level, which has flipped into strong resistance. Price action shows $SHIB trading below this zone after a prolonged downtrend, confirming sustained selling pressure. Each attempt to push higher has faced rejection, signaling that sellers still control the market structure. This level now acts as a key decision area where momentum could either stabilize or continue lower.
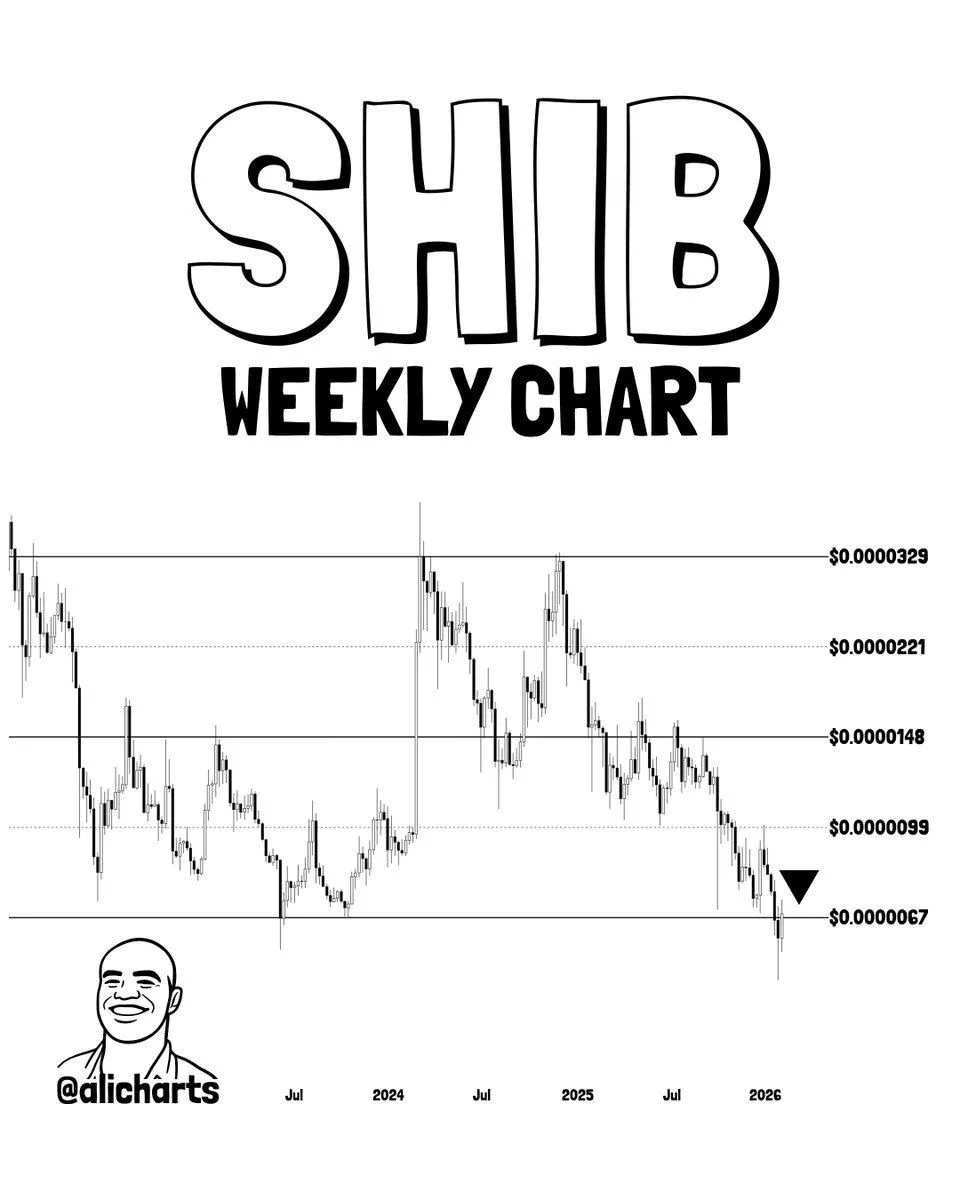
For bullish continuation, $SHIB must reclaim $0.0000067 and hold it as solid support. A successful reclaim would suggest renewed buyer strength and improved market confidence. If that happens, price could gradually push toward the next major resistance near $0.0000099. This level represents a previous consolidation zone and would be a critical test for trend reversal strength.
$SHIB Maintains Bearish Structure as Indicators Signal Consolidation
From the 1-day Shiba Inu price chart, the trend remains bearish with price forming lower highs and lower lows. $SHIB has struggled to sustain rallies, showing weak buying follow-through after short recoveries. The recent bounce near the $0.0000065 area suggests minor stabilization, but the price is still trading below key resistance zones. This structure indicates that sellers remain in control unless a clear higher high is formed.
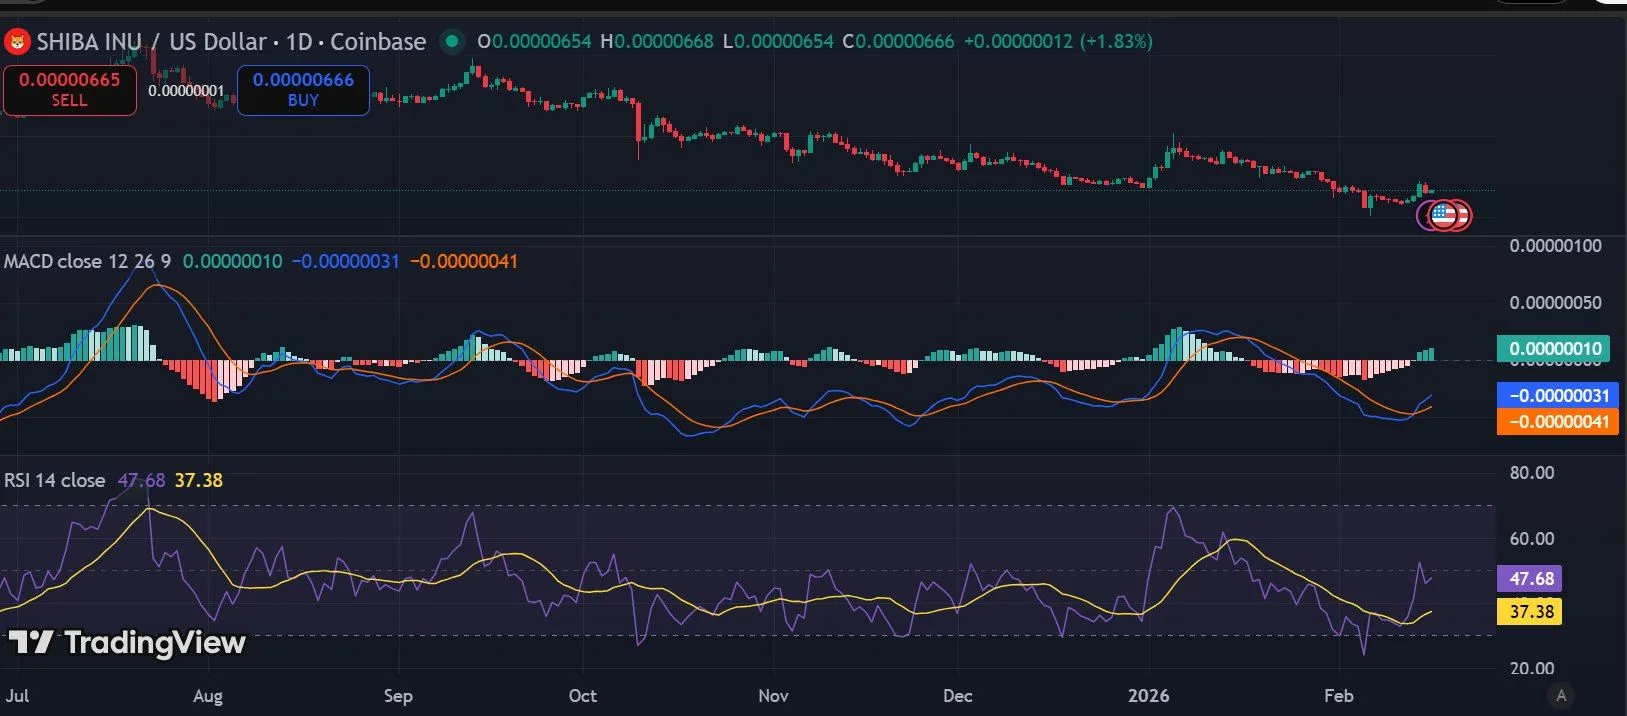
Looking at the indicators, the MACD is still below the zero line, reflecting ongoing bearish momentum. However, the histogram is slightly improving, hinting at weakening selling pressure. The RSI is hovering near the mid-40s, showing neutral momentum without clear overbought or oversold conditions. This combination suggests consolidation, with the market waiting for a stronger directional move.