$XRP Price Analysis: Navigating the Supply Wall
The $XRP/USD chart highlights a "compression regime." After falling from January highs near $2.41, the price found a base at the $1.30 pivot.
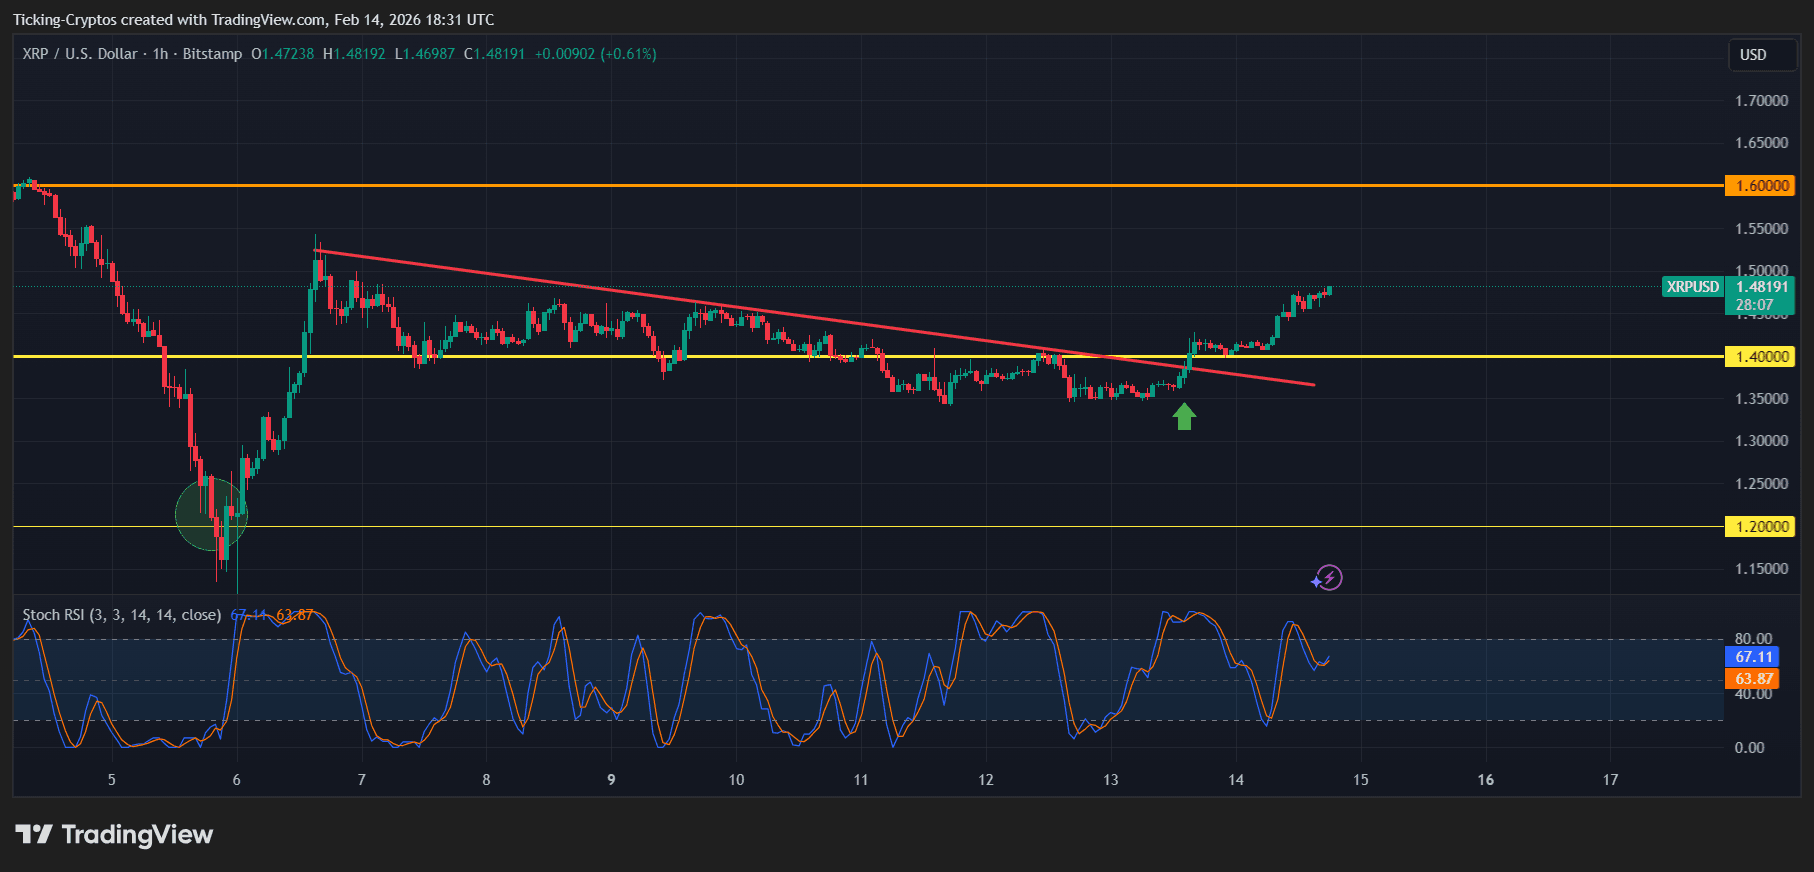
$XRP/USD 1H - TradingView
Key Resistance and Support Levels
-
Immediate Resistance ($1.50 - $1.54): This is the primary "supply wall." $XRP has seen multiple rejections here in early February. A daily close above $1.54 is required to flip market sentiment from neutral to bullish.
-
The $1.83 Hurdle: This level aligns with the 200-day Moving Average (MA). Reclaiming this would confirm a medium-term trend reversal.
-
Critical Support ($1.30): This "line in the sand" must hold. If $XRP fails to stay above $1.30, the probability of a "flush" toward the $1.11 - $1.15 zone increases significantly.
Institutional Drivers
Recent data from major outlets suggests that Ripple’s recent infrastructure upgrades—including the integration of Figment’s staking infrastructure into its custody workflows—are bolstering institutional confidence. Furthermore, the RLUSD stablecoin surpassing a $1 billion market cap provides additional utility and liquidity to the $XRP Ledger (XRPL).
$XRP Price Prediction: High and Low Targets for 2026
Looking ahead, the $XRP forecast remains tied to both technical breakouts and macroeconomic stability.
Bullish Scenario: Target $2.10 – $3.60
If $XRP decisively clears the $1.55 resistance, the next technical magnet is the $1.85 level, followed by a psychological test at $2.00. Many analysts point to April 2026 as a potential "breakout month," with historical data suggesting seasonal strength that could push the price toward a maximum target of $4.06 if a new bull cycle ignites.
Bearish Scenario: Target $1.15 – $0.85
Should the current 4% jump fail to attract enough "follow-through" volume, a retest of the $1.15 support is likely. In an extreme bearish scenario where $Bitcoin falls back toward $52,000, $XRP could wick down to the $0.85 demand zone, which has historically acted as a major accumulation point for whales.
Why $XRP is Outperforming Today
-
Macro Tailwinds: US inflation (CPI) fell to 2.4% in January, lower than the 2.5% expected. This has fueled hopes for Fed rate cuts, benefiting "risk-on" assets like $XRP.
-
Increased On-Chain Activity: The $XRP Ledger has seen a spike in active addresses and transactions, often a leading indicator of a price bounce.
-
ETF Momentum: Continued accumulation by institutional spot $XRP ETF providers provides a steady buy-side pressure that was absent in previous years.
Summary of the $XRP Forecast
Analyst Note: The $1.38–$1.46 corridor is currently a "tactical hinge." As long as price remains below $1.50, the trend is considered corrective. Reclaiming $1.50 on a weekly close would be a significant structural shift for the bulls.

 cryptoticker.io