
Bitcoin, Ether, XRP, and other leading cryptocurrencies are in the red after a brief rally on Wednesday.
Solana’s $SOL is the worst performer among the top 10 cryptocurrencies by market cap, down 2.5% since Thursday.
It is currently trading at $79 per coin, following a correction of over 9% since the start of the week.
On-chain and derivatives data show mixed sentiment among traders, making it harder for $SOL to embark on a sustainable recovery.
On-chain and derivatives data suggest mixed sentiment for Solana
Copy link to section
$SOL is the worst performer among the top 10 cryptocurrencies this week as it is down 9% over the last few days.
The bearish performance comes despite institutional demand for $SOL ETFs returning this week.
According to SoSoValue, Solana spot Exchange Traded Funds (ETFs) recorded inflows of $11.60 million through Thursday, ending two consecutive weeks of withdrawals.
If the inflows continue, $SOL’s price could rally higher in the near term.
In addition to that, CryptoQuant’s summary data shows a positive outlook, despite the current bearish price action.
$SOL spot and futures market show large whale orders, cooling conditions, and buy dominance, suggesting a potential recovery for the cryptocurrency.
However, the derivatives market indicates caution among retail investors.
According to CoinGlass, $SOL’s funding rate flipped negative on Friday, reading -0.0014%.
The negative funding rate indicates that short positions are paying longs and hinting at a bearish sentiment.
Finally, $SOL’s Open Interest (OI) dipped to $5.01 billion on Friday, and it has been declining steadily since mid-January.
The OI has now reached levels not seen since mid-April 2025. The decline in OI indicates waning investor participation and projects a bearish outlook.
The mixed market sentiment highlights growing uncertainty among traders, and this could affect a possible bullish recovery.
$SOL could dip to $60 if the bearish trend persists
Copy link to section
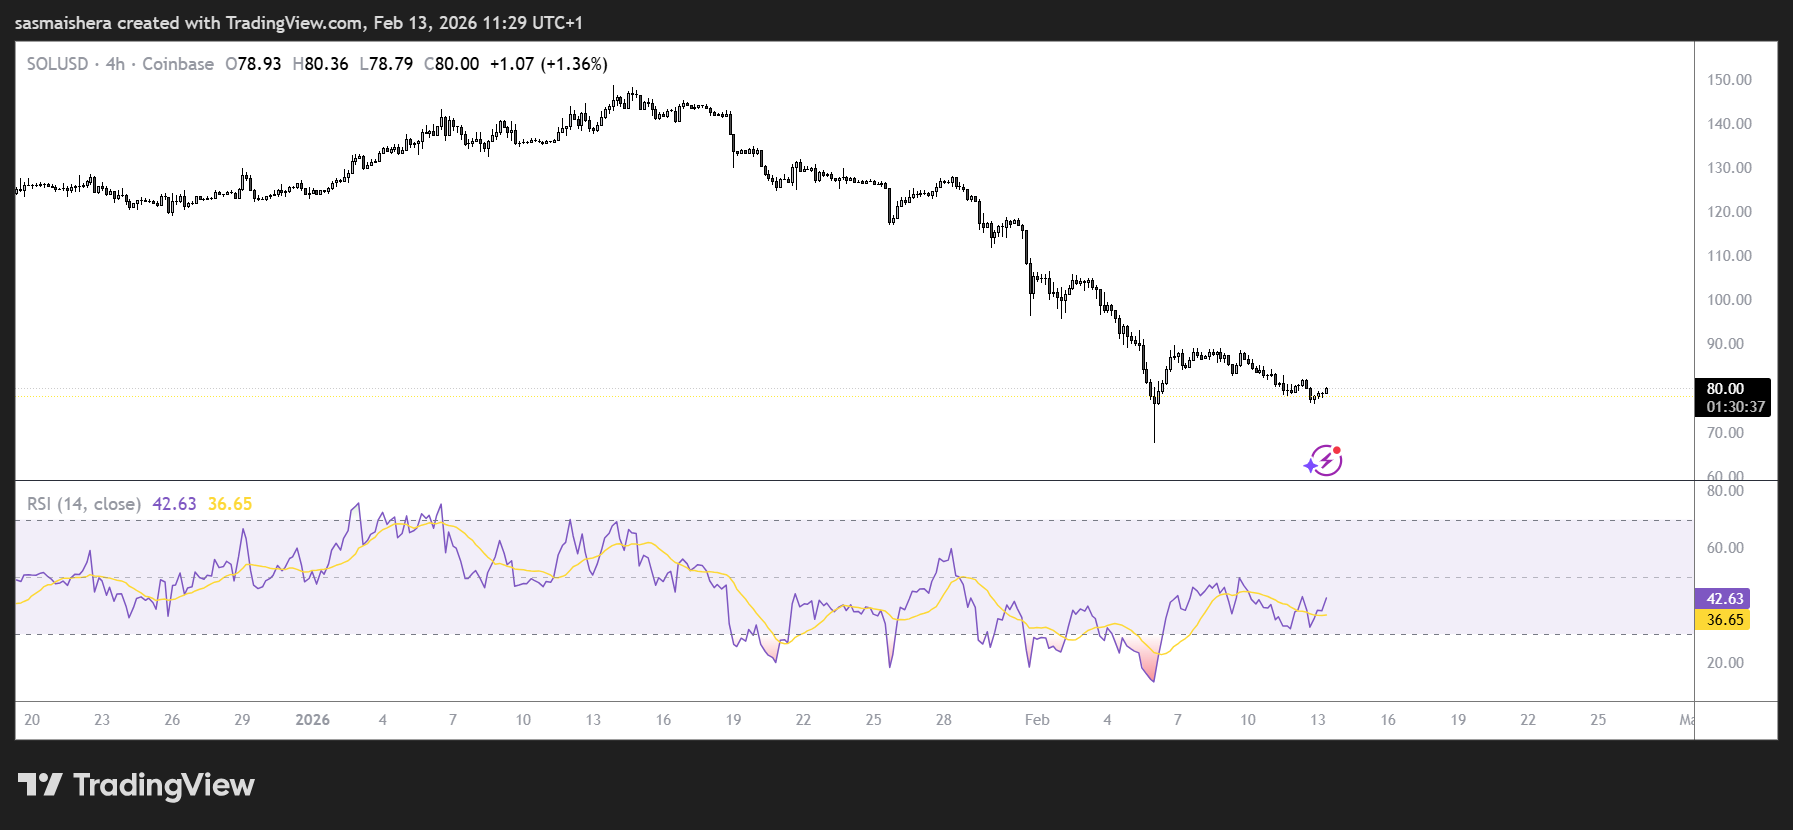
Aligning with the broader crypto market, the $SOL/USD 4-hour chart is bearish as Solana’s price extended its correction this week, falling nearly 9% following last week’s massive dip.
At press time, $SOL is trading at $79.87. If the downtrend continues, $SOL could extend the decline toward last week’s low of $67.50.
Closing below this level could see the asset extend further losses toward the next key psychological level at $60.
The Relative Strength Index (RSI) on the 4-hour chart reads 36, approaching the extreme oversold condition, indicating strong bearish momentum.
The Moving Average Convergence Divergence (MACD) also showed a bearish crossover three weeks ago, which remains intact, further supporting the negative outlook.
However, if the bulls regain control, $SOL could extend its recovery toward the key psychological level at $80.
Further bullish movement would expose $SOL to the Monday high of $88.01.