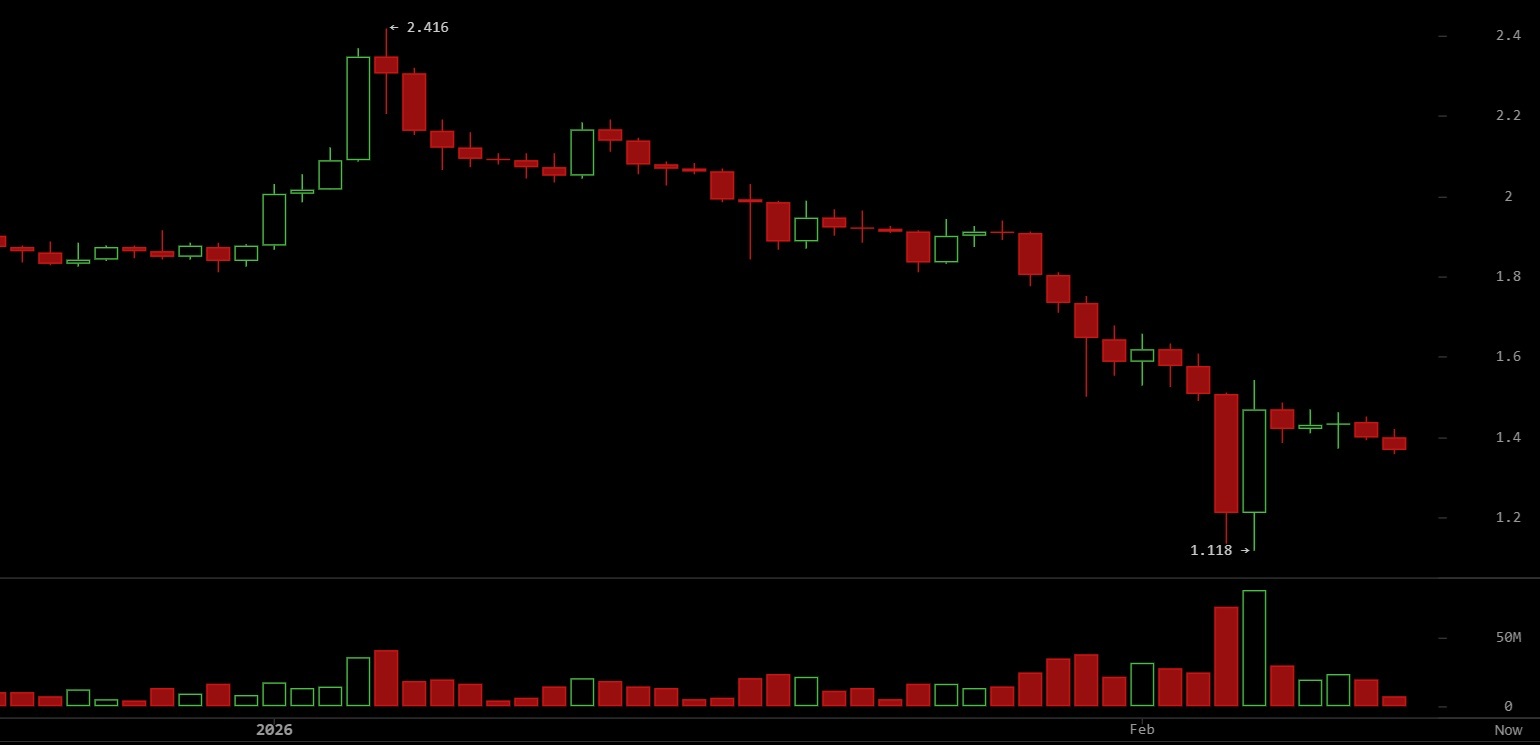
$XRP 1-hour chart via Bitstamp on Feb. 11, 2026.
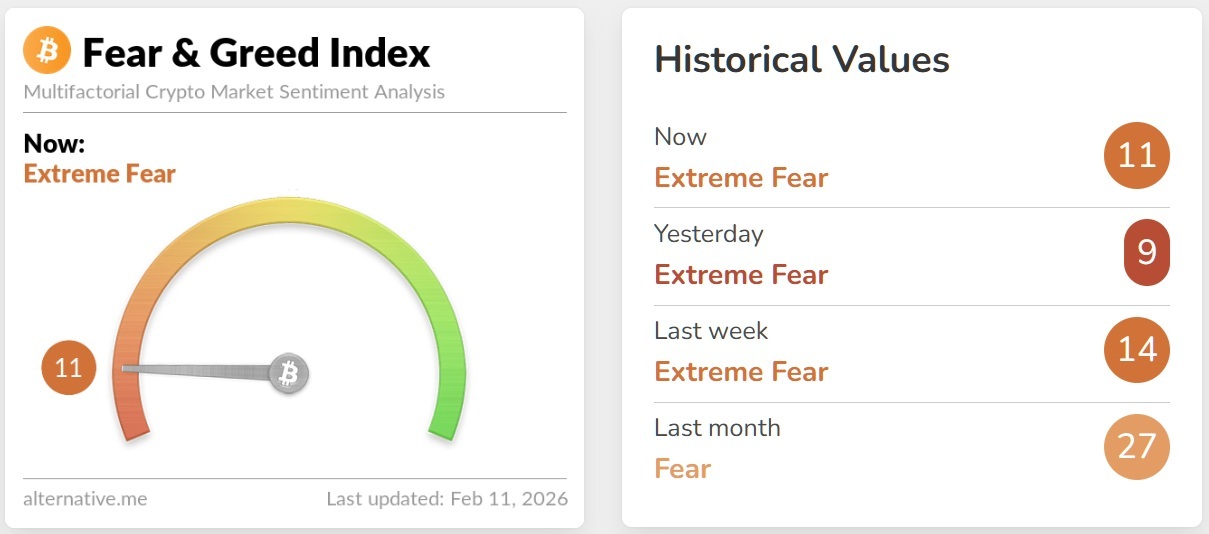
The drop is unfolding amid a broader “risk-off” mood across the cryptocurrency market and signs of growing investor caution. The Fear & Greed Index currently stands at 11, categorized as “Extreme Fear.” Bitcoin has slipped below $67,000, while ethereum has fallen more than 4% toward $2,000, adding pressure across major digital assets. Data from analysts, including Glassnode, show $XRP’s Spent Output Profit Ratio has declined to 0.96, indicating that, on average, holders are selling at a loss. Exchange inflows have also risen, suggesting more tokens are being moved onto trading platforms. The weakness comes as Ripple begins its $XRP Community Day on Feb. 11-12, featuring CEO Brad Garlinghouse and a forward-looking roadmap, with some market participants appearing to wait for concrete announcements before reentering positions.
Technical indicators reflect sustained downside pressure on the hourly timeframe. The Relative Strength Index ( RSI) is positioned below the 50 level, indicating bearish momentum but not yet at extreme oversold readings. The Moving Average Convergence Divergence ( MACD) remains in bearish alignment, with the MACD line below the signal line and the histogram in negative territory, underscoring fading upward momentum since the $1.50 rejection. From a Moving Average (MA) perspective, $XRP is trading beneath its short-term moving averages, reinforcing resistance in the $1.40 to $1.45 zone. Bollinger Bands widened significantly during the high- volatility swing between $1.20 and $1.50 and have begun to narrow, with price now pressing near the lower band as it hovers in the mid-$1.30s.
A break below the 24-hour low of $1.35719 would establish a fresh intraday low and could expose the $1.35 area, with further downside potentially revisiting the broader post-rebound support above $1.30. On the upside, reclaiming $1.40 would be required to challenge the most recent lower high and begin stabilizing the short-term structure.
Read more: $XRP Rebounds as Whale Accumulation and Network Activity Signal Price Reversal
FAQ 🧭
-
What does $XRP trading near the bottom of its daily range signal for short-term investors?
Price action hovering near the session low reflects sustained selling pressure and weak momentum, increasing the likelihood of further downside if nearby support levels break.
-
How do on-chain metrics like SOPR and rising exchange inflows impact $XRP’s outlook?
A Spent Output Profit Ratio below 1 and increasing exchange inflows indicate holders are realizing losses and moving tokens to exchanges, pointing to continued distribution risk.
-
What do current technical indicators suggest about $XRP’s market structure?
Bearish RSI positioning, a negative MACD setup, and price below short-term moving averages reinforce resistance around the $1.40 to $1.45 zone and signal fading recovery strength.
-
Why are broader market sentiment and Ripple’s Community Day key catalysts for $XRP?
Extreme Fear conditions across crypto markets, combined with anticipation around Ripple’s roadmap updates, could drive volatility, with clear announcements potentially shaping the next directional move.

 news.bitcoin.com