
Shiba Inu trades below its 20-day SMA as one analyst assesses support levels and outlines a potential long-term recovery scenario.
The Shiba Inu ($SHIB) market is back under pressure, and the latest numbers show sellers tightening their grip. $SHIB is currently trading at $0.000005845, down 2.1% over the past 24 hours, after fading from intraday highs. The token moved within a defined daily range of $0.000005845 to $0.000006067, reflecting a steady downside push toward the lower boundary of its short-term structure.
Despite the daily dip, $SHIB is showing relative strength against Bitcoin, gaining 1.3% versus $BTC and 1.1% against Ethereum on the day. Market cap stands at approximately $3.44 billion, with a 24-hour trading volume of $131.8 million, indicating continued participation even as the price compresses.
Broader performance, however, highlights ongoing strain. $SHIB is down 14.0% over seven days and 24.8% in the last 14 days. On higher timeframes, $SHIB is down 31.6% over 30 days and 64.2% over the past year, underscoring persistent weakness.
With price pressing the lower end of its daily range while still outperforming $BTC short term, the question now becomes clear: is this quiet pullback setting up the next bounce?
Shiba Inu Setting up for a Bounce?
On the daily timeframe, Shiba Inu’s price has bounced off the lower Bollinger Band around $0.0000054112, which now acts as immediate support. A move or close below that level would expose $SHIB to deeper downside toward the psychological $0.0000050 region. The fact that price continues to ride the lower band signals persistent selling pressure rather than a confirmed bounce.
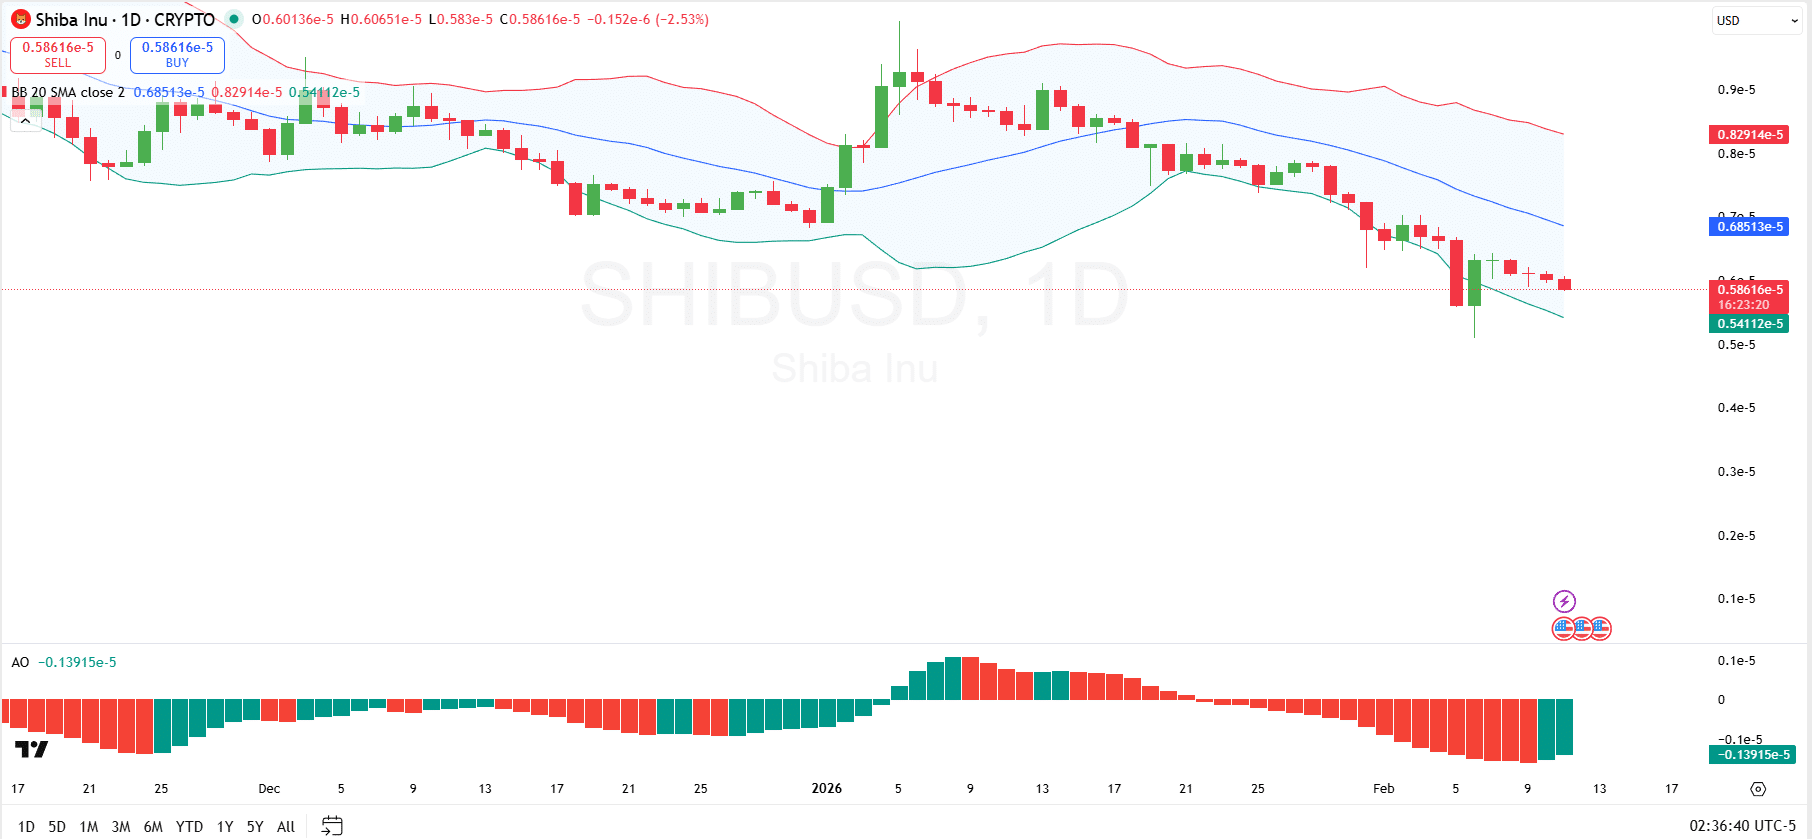
On the upside, the first key barrier sits near the 20-day SMA, Bollinger mid-band, around $0.0000068513, which has capped recent recovery attempts. Above that, the upper Bollinger Band near $0.0000082914 represents the broader volatility ceiling. Until $SHIB reclaims the mid-band and establishes acceptance above it, any bounce is likely to remain corrective within a prevailing bearish structure.
Further, momentum indicators reinforce caution. The Awesome Oscillator remains in negative territory at approximately 0.0000013915, confirming bearish momentum dominance. Although the latest histogram bars show green candles and a slight contraction in downside momentum, the oscillator has not yet crossed into positive territory.
For a meaningful bounce in bias, traders would need to see AO flip above zero alongside price reclaiming the 20-day SMA; otherwise, downside risks remain elevated.
$SHIB Reversal Incoming?
In a separate social media commentary, Crypto GVR said $SHIB may be forming a base for a potential reversal within the $0.000005–$0.0000061 zone. He framed it as an area where buyers could step in after the recent slide.
Notably, the analyst mapped long-term upside targets in the $0.00002–$0.00003 range, positioning the move as a longer-horizon hold.