- Ondo price hovered near $0.24, down around 6%.
- If there’s a breakout, $ONDO could target $0.45 in the near term.
-
$ONDO could dive below $0.20 if bulls fail to hold onto gains.
The $ONDO token climbed to nearly $0.30 as improving sentiment lifted much of the altcoin market, including the real-world asset tokenisation project.
However, selling pressure emerged near a key resistance level, with the price down about 6% over the past 24 hours at the time of writing on Monday, February 9, 2026.
As a result, despite a mildly constructive technical setup, a deeper pullback could undermine near-term upside momentum and weigh further on the price of $ONDO.
Ondo price recap: bounce hits supply wall
Like several major altcoins, $ONDO rebounded from the $0.20 level as cryptocurrencies recovered from the sell-off on February 5.
However, buying momentum weakened near $0.27, where selling pressure held over the weekend, establishing the area as a strong supply zone.
On Monday, the token moved lower again, falling about 6% to trade just above $0.24.
The decline was accompanied by an 8% rise in trading volume, pointing to continued seller dominance.
The weakness has come as Bitcoin struggles to regain traction around the $70,000 level, with broader market sentiment remaining negative.
On-chain data across the sector indicates sustained selling from early investors and large holders.
$ONDO remains under pressure and is down about 14% over the past week, in line with similar declines across RWA-related tokens.
Ondo price outlook: up or risk of fresh pain?
The broader outlook for $ONDO continues to reflect a balance between technical factors and wider macroeconomic pressures.
Signals on the daily chart are mixed. The relative strength index (RSI) is near 32 and trending lower, indicating scope for a deeper move into oversold territory.
At the same time, the Moving Average Convergence Divergence (MACD) is pointing to a potential bullish crossover, with the histogram showing easing downside momentum.
One notable feature on the higher-timeframe chart is a tightening falling wedge visible on the weekly timeframe.
The pattern currently leans in favour of bulls, with price action tracking close to the upper trend line.
$ONDO has largely consolidated within this structure through much of 2026 and has repeatedly rebounded from the lower boundary, reinforcing the pattern’s significance.
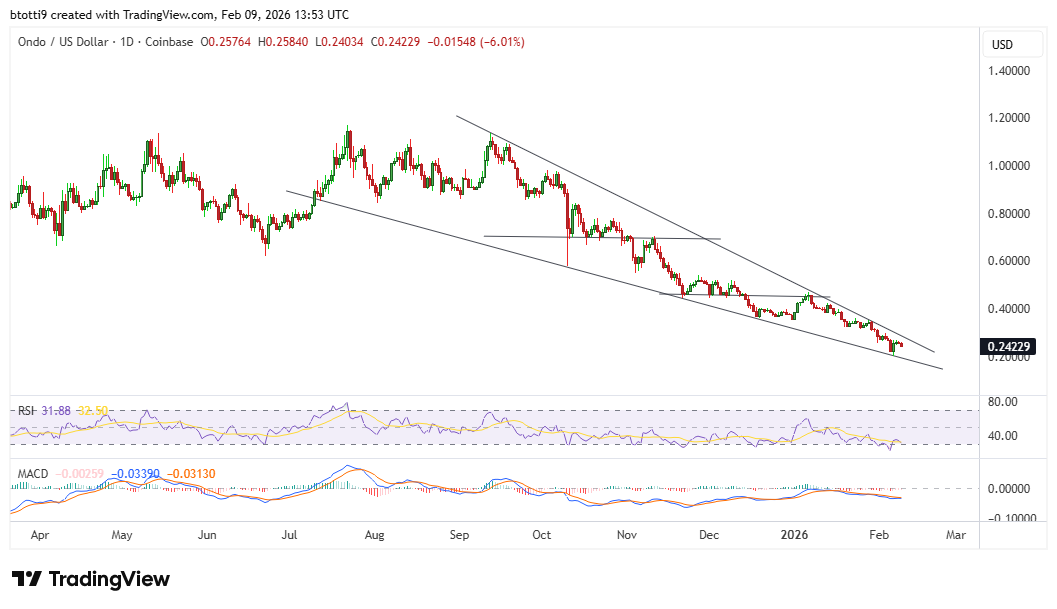
Ondo price chart by TradingView
If a breakout materialises, $ONDO could target the $0.45 level in the near term, with scope to extend toward $0.70 if momentum strengthens.
However, downside risks remain elevated.
The broader cryptocurrency market continues to trade weakly, with Bitcoin struggling below $69,000 and Ethereum facing repeated rejection near $2,000.
Sentiment remains fragile, with the CoinMarketCap Crypto Fear and Greed Index at 9, firmly in extreme fear territory.
High liquidation activity, exceeding $344 million over the past 24 hours, also points to continued market stress.
If $ONDO fails to hold support at $0.21, analysts warn that a pullback toward the $0.17 level could follow.