Shiba Inu remains under pressure as resistance cap rebounds, while falling open interest and weak momentum continue to limit upside potential.
The Shiba Inu ($SHIB) market is once again testing trader patience, as the latest session shows sellers maintaining control despite brief intraday rebounds. $SHIB is trading near $0.000006105, down about 1.26% over the past 24 hours. The price action is confined in a relatively narrow but volatile daily range between roughly $0.00000609 and $0.0000063.
Early in the session, $SHIB attempted to hold above the mid-range, but selling pressure steadily increased, dragging the price back toward the lower end of the band. Market activity remains active, with $21.84M in spot volume and $86.42M in futures volume, suggesting that derivatives traders continue to dominate short-term price discovery.
Performance across timeframes reinforces the bearish tone. $SHIB is down 1.23% over both the 4-hour and 24-hour windows, while losses deepen to 7.91% over seven days. The drawdown extends further over longer horizons, with $SHIB down 29.48% over 30 days, and 39.74% over 90 days. While long-term performance still shows outsized gains on an all-time basis, recent momentum clearly favors sellers. Can bulls shift momentum?
Can $SHIB Bulls Shift the Momentum?
On the daily chart, Shiba Inu remains under clear technical pressure, with price sitting below the Bollinger Bands midline. The 20-day SMA (mid-band) sits around $0.00000705, acting as immediate overhead resistance, while the upper band sits near $0.00000847, marking a much higher recovery hurdle.
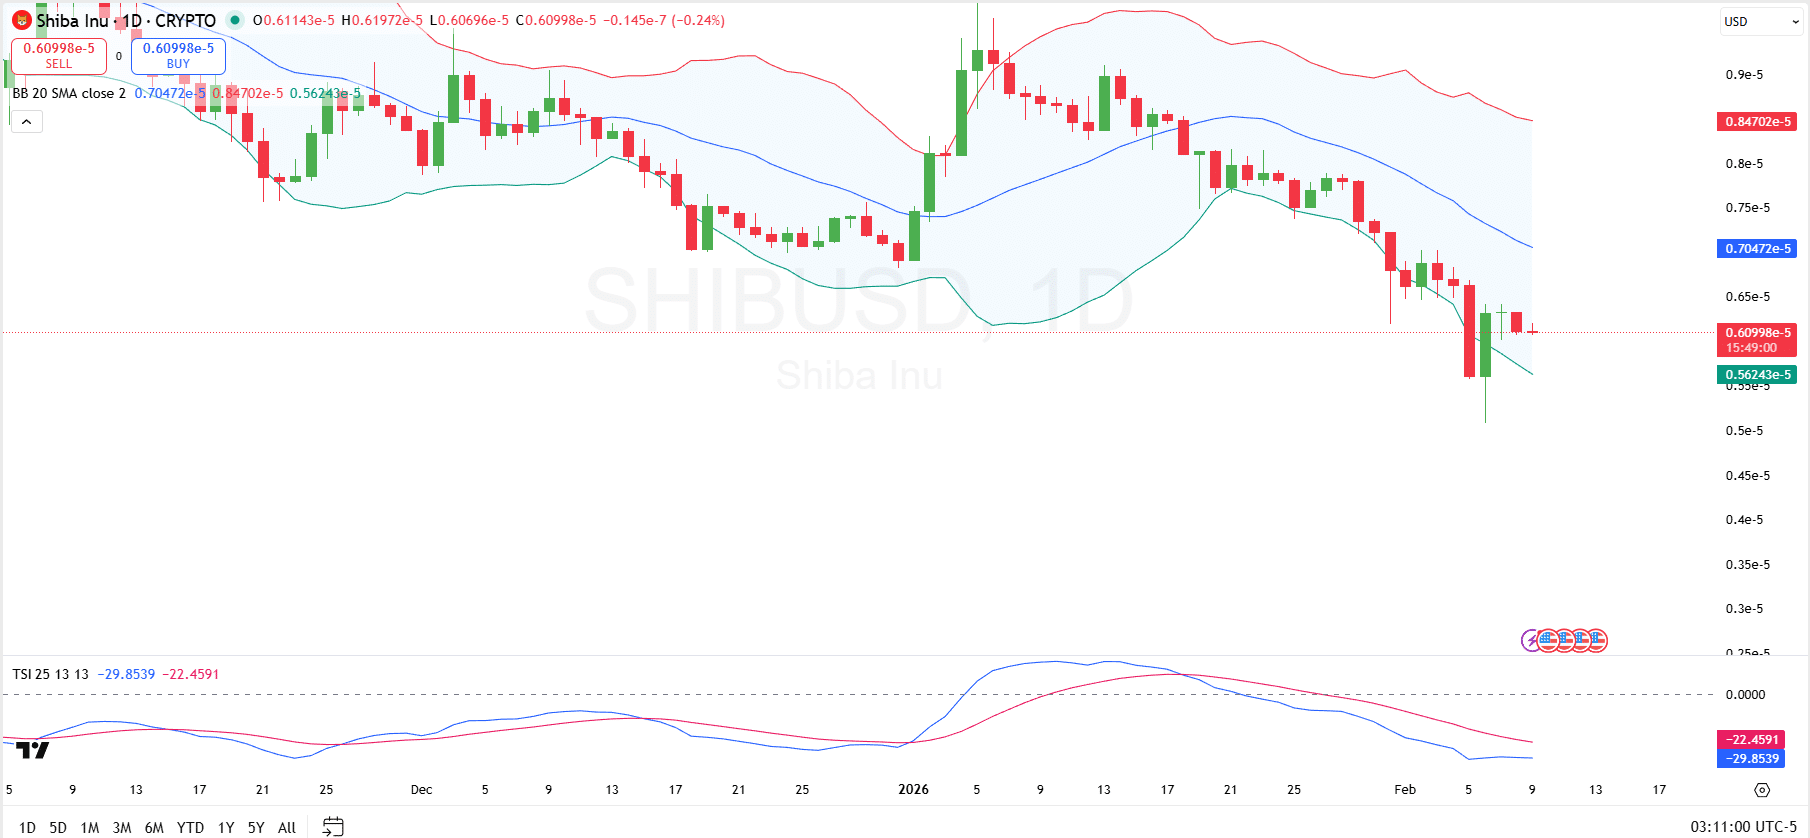
On the downside, the lower Bollinger Band is around $0.00000562, which defines the next volatility-based support zone. Price has recently bounced below this band, making it an important support for $SHIB to hold.
Momentum indicators continue to support the bearish bias. The True Strength Index remains deeply negative, with readings of 29.85 on the main line and 22.46 on the signal line, both below the zero axis. This configuration typically signals sustained downside momentum, unless the TSI can flip over the signal line.
From a level-based perspective, support is concentrated between $0.00000560 and $0.00000580, while near-term resistance sits at $0.00000630–$0.00000680. A stronger recovery would require a daily close above the $0.00000705 mid-band to neutralize downside pressure, with $0.00000847 remaining the major resistance cap.
Shiba Inu Open Interest Declining?
Shiba Inu’s open interest data points to continued deleveraging alongside price weakness, reinforcing the cautious tone across derivatives markets. Open interest has steadily declined from the $200 million–$250 million range recorded in late September 2025 to approximately $65.75 million as of February 9, 2026, according to CoinGlass.
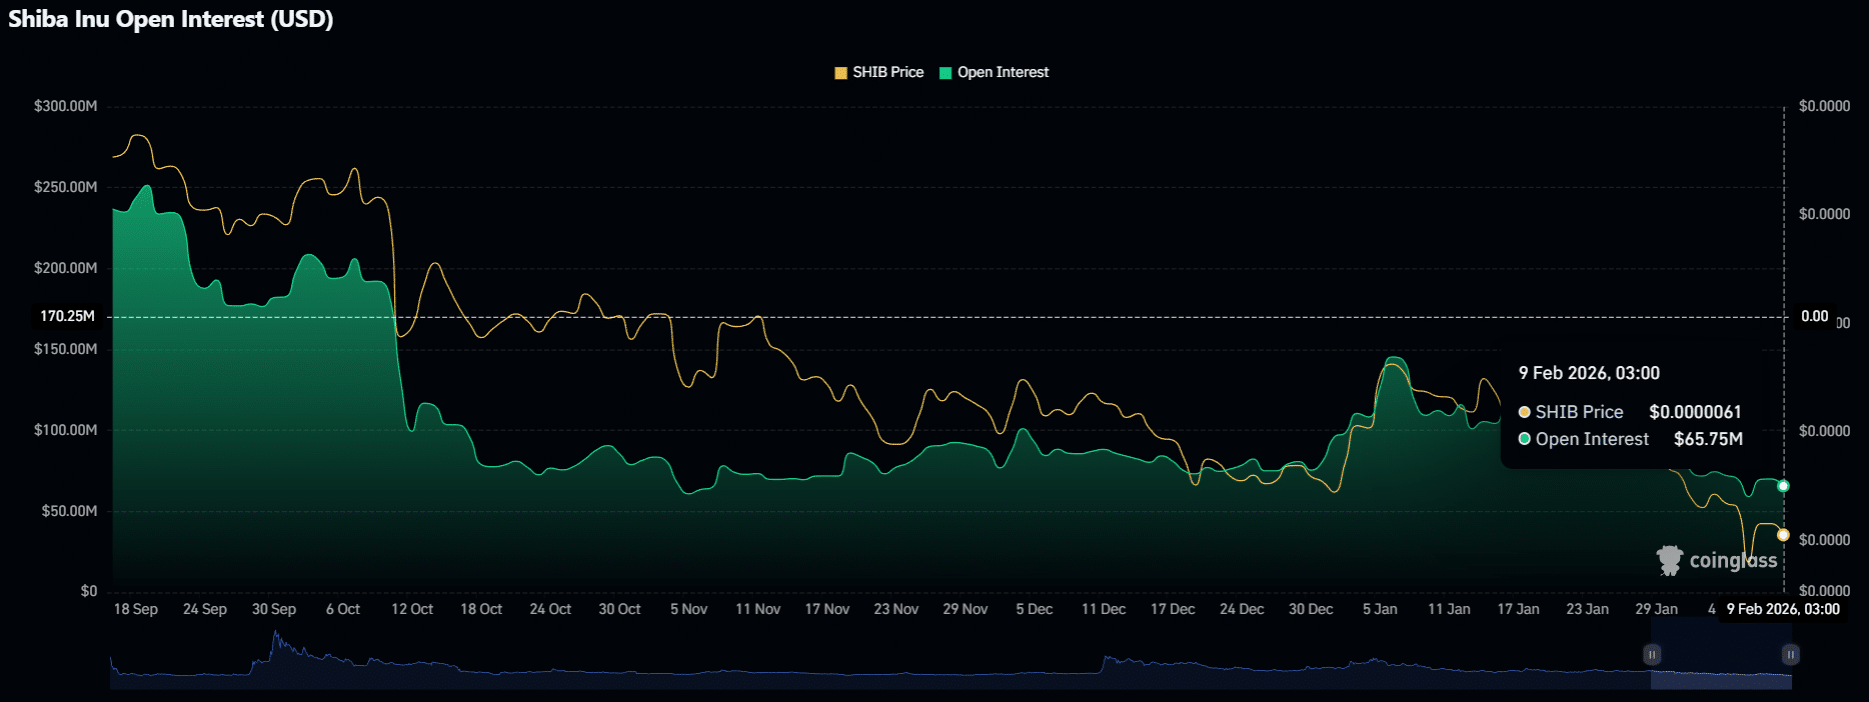
While there was a brief pickup in early January, when open interest rebounded toward the $150M zone alongside a short-lived price bounce, that move failed to sustain, and both price and open interest rolled over again. The current setup suggests traders are reducing leveraged exposure rather than positioning aggressively for a rebound.