coinpaper.com

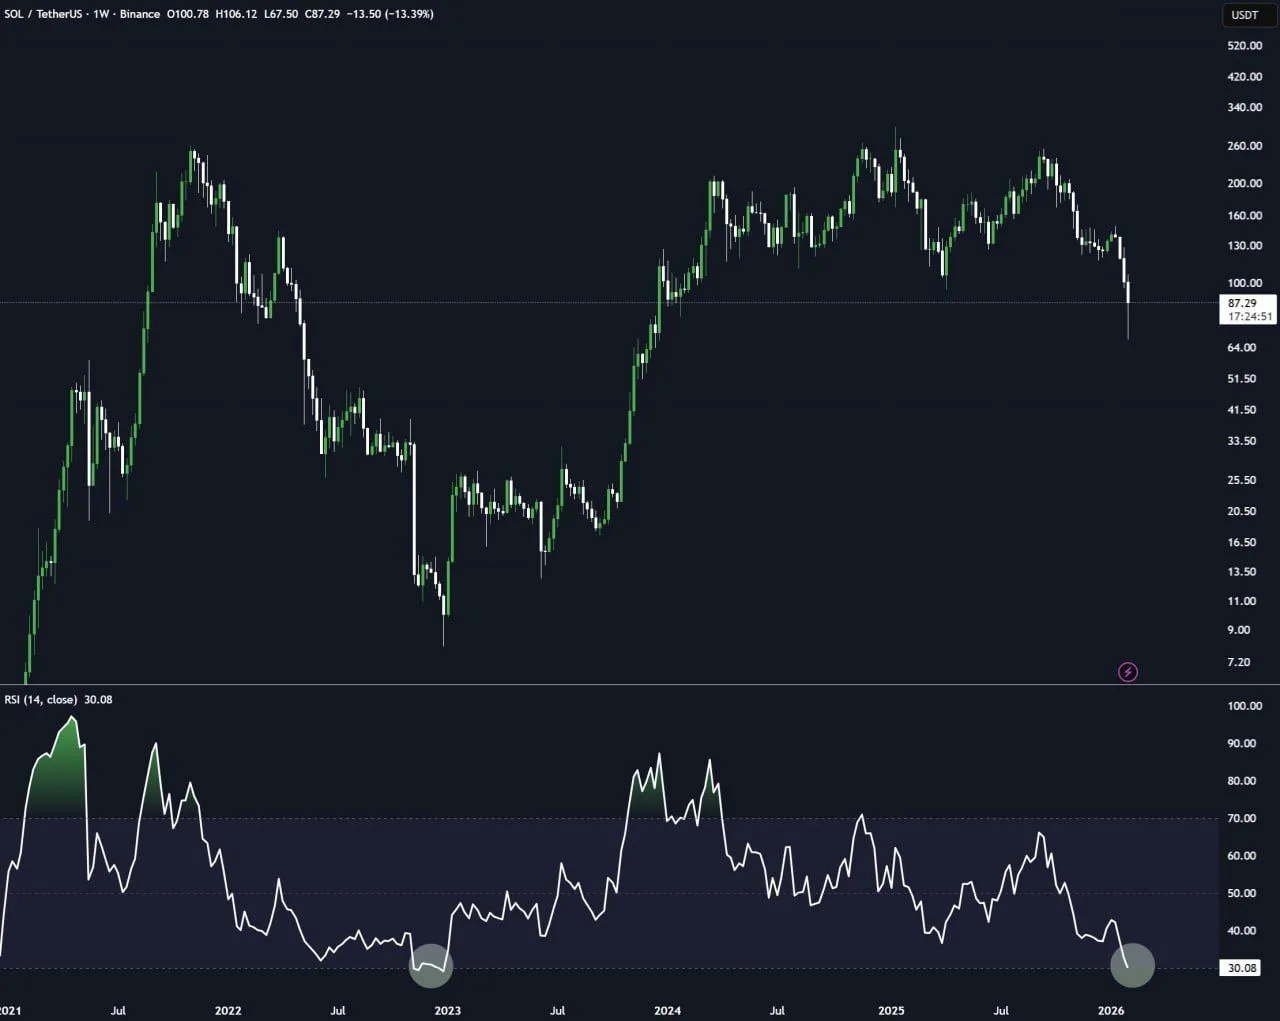
Solana’s weekly chart is sending mixed but high signal messages, as two analysts point to a possible cycle turning point. One calls the latest selloff the last shakeout, while another highlights the most oversold weekly momentum read in $SOL’s history.
Trader flags “final dip” on $SOL weekly chart
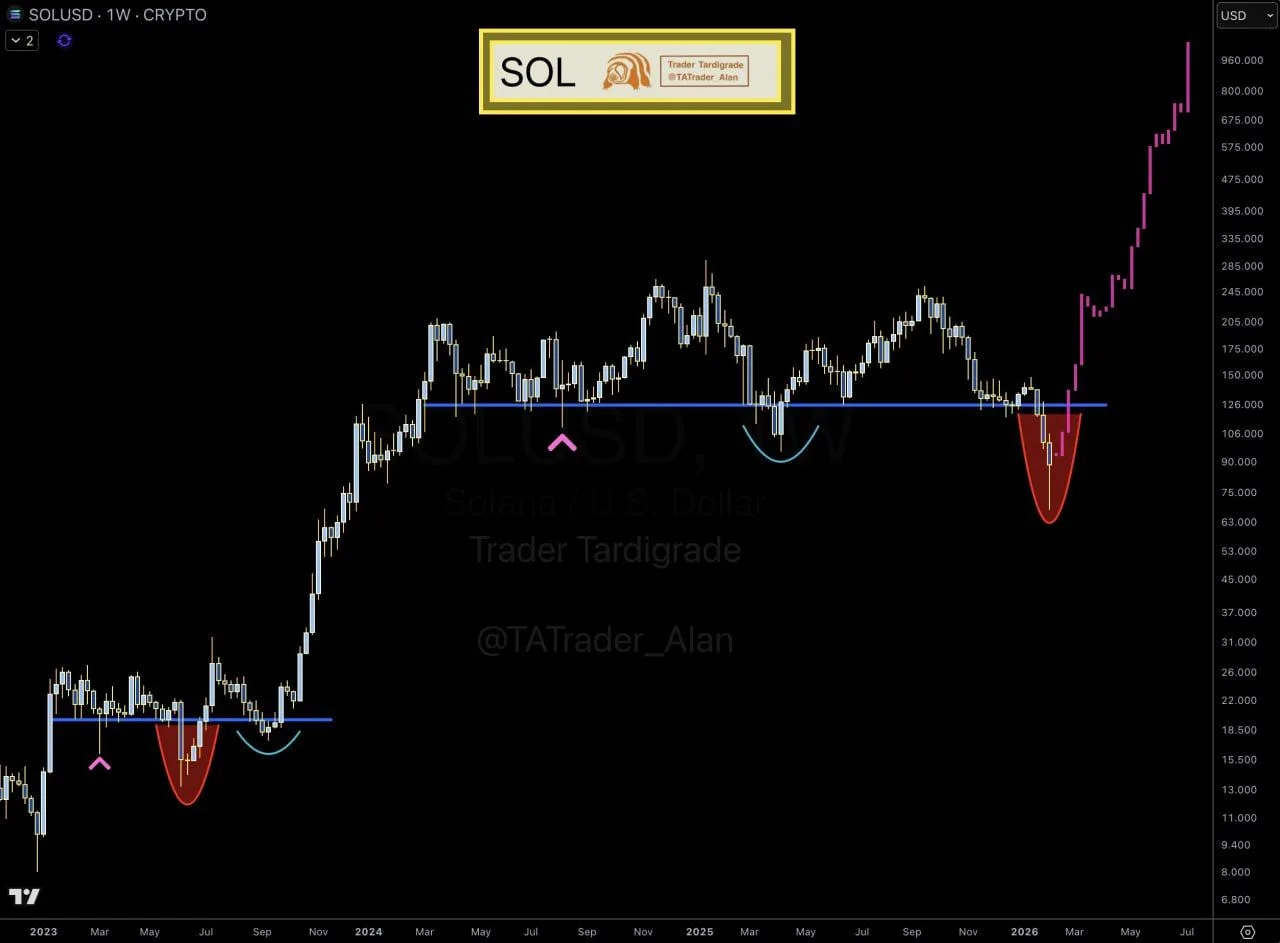
Crypto trader Trader Tardigrade, who posts as @TATrader_Alan on X, said Solana “made its final dip” and is setting up for a new bullish cycle after a long consolidation on the weekly chart.
The chart shows SOLUSD holding a long-term horizontal level that acted as both support and resistance across several market phases. Price dipped below that level during the recent drawdown, then quickly reclaimed it. That reclaim follows a pattern seen earlier in the cycle, where similar rounded pullbacks formed near the same zone before upside continuation.