Expectations are slightly stronger for June 30, 2026, but remain subdued, with the probability at 10%, down 14%, indicating that traders have also scaled back mid-year optimism.
Meanwhile, the September 30, 2026 market assigns a 17% probability to $XRP reaching a new all-time high, the highest among the listed dates, but this has fallen by 14%, signaling waning confidence even in the most bullish window.
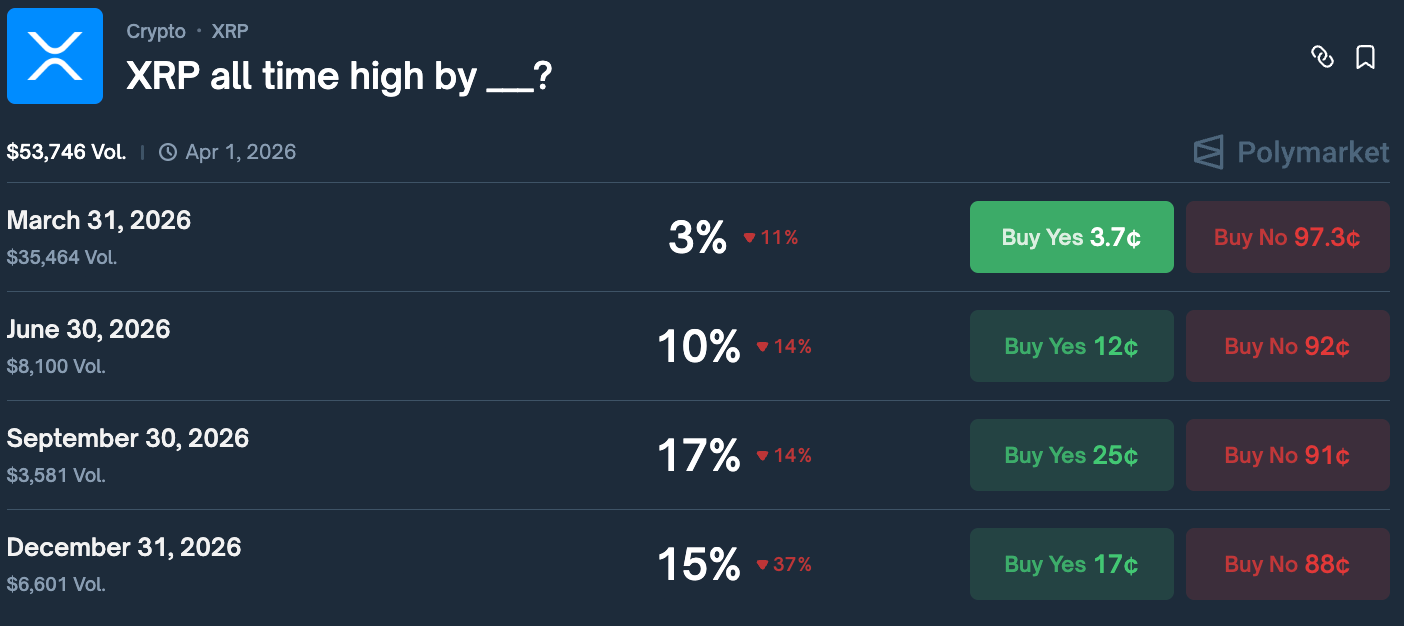
By December 31, 2026, the probability drops to 15% after a sharp 37% decline, the steepest across all dates, reflecting growing doubt that $XRP can sustain enough momentum into year-end to surpass past highs.
Trading activity is strongest around the March 31, 2026 contract, showing a clear focus on the near-term outlook, while longer-dated markets post lower but steady volumes, pointing to continued yet cautious longer-term engagement.
$XRP price crash
Indeed, the drop in probability for $XRP hitting a new record high comes after the asset suffered massive losses in line with the recent market crash led by Bitcoin (BTC).
Over the past week, the token endured a dramatic sell-off, plunging roughly 20% to lows near $1.14, triggered by leveraged position unwinds, fading risk appetite, and macro headwinds such as tighter monetary policy.
However, at one point, $XRP staged a strong rebound, outpacing peers like Bitcoin and Ethereum in the recovery.
Analysts attributed the quick bounce to oversold conditions, whale accumulation on dips, surging spot trading volumes, and thin liquidity on exchanges amplifying price moves. However, the asset has seen notable losses in the past 24 hours.
$XRP price analysis
By press time, $XRP was trading at $1.41, down 2.5% over the past 24 hours. On a weekly basis, the token is down more than 11%.
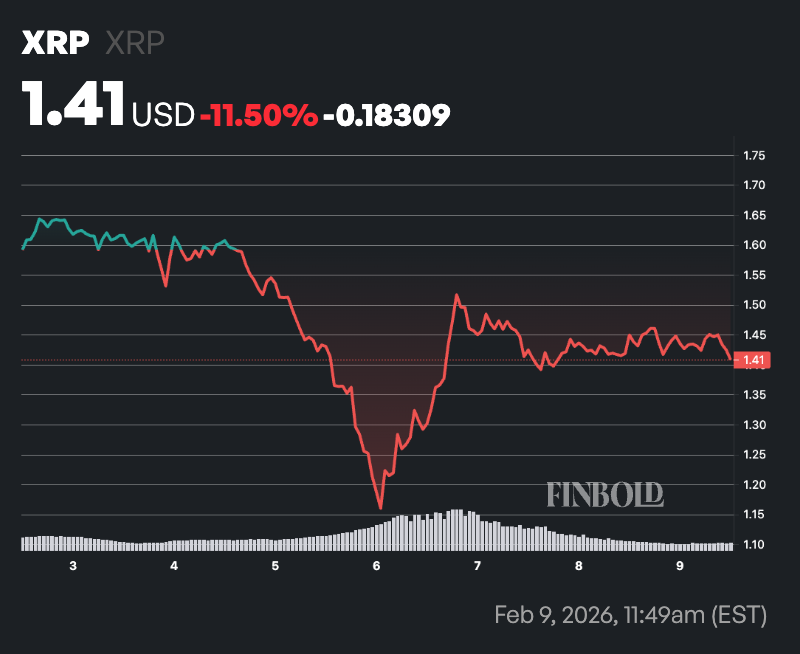
In this line, $XRP is trading well below its key moving averages (MA), keeping the broader technical picture tilted to the downside. The 50-day SMA at $1.90 and the 200-day SMA at $2.40 both sit far above the current price, signaling that $XRP remains in a firmly bearish trend across both the medium and long term.
At the same time, the 14-day RSI at 37.57 sits in neutral territory but leans toward the lower end of the range. This indicates weakening momentum rather than outright exhaustion. $XRP is not yet technically oversold, meaning downside risk still exists, but the RSI level also suggests that selling pressure may be gradually stabilizing rather than accelerating.
Featured image via Shutterstock

 finbold.com