
Solana showed fresh weakness versus Bitcoin and in dollar terms after charts flagged a bearish monthly close on SOLBTC and a weekly breakdown on $SOL USD. Together, the setups point to fading momentum and rising pressure on key support zones.
Solana Slips Against Bitcoin as $SOL $BTC Closes Below Key Monthly Level
Solana weakened versus Bitcoin after the $SOL/$BTC pair finished the month back under a major support and resistance area, according to a TradingView chart shared by X user Don Omar.
The monthly candle closed around 0.00125 $BTC after trading as high as about 0.00135 $BTC and as low as about 0.00112 $BTC on Binance, the chart shows. The move left $SOL/$BTC below the marked monthly line near 0.00144 $BTC, a level the chart labels as a break point for strength.
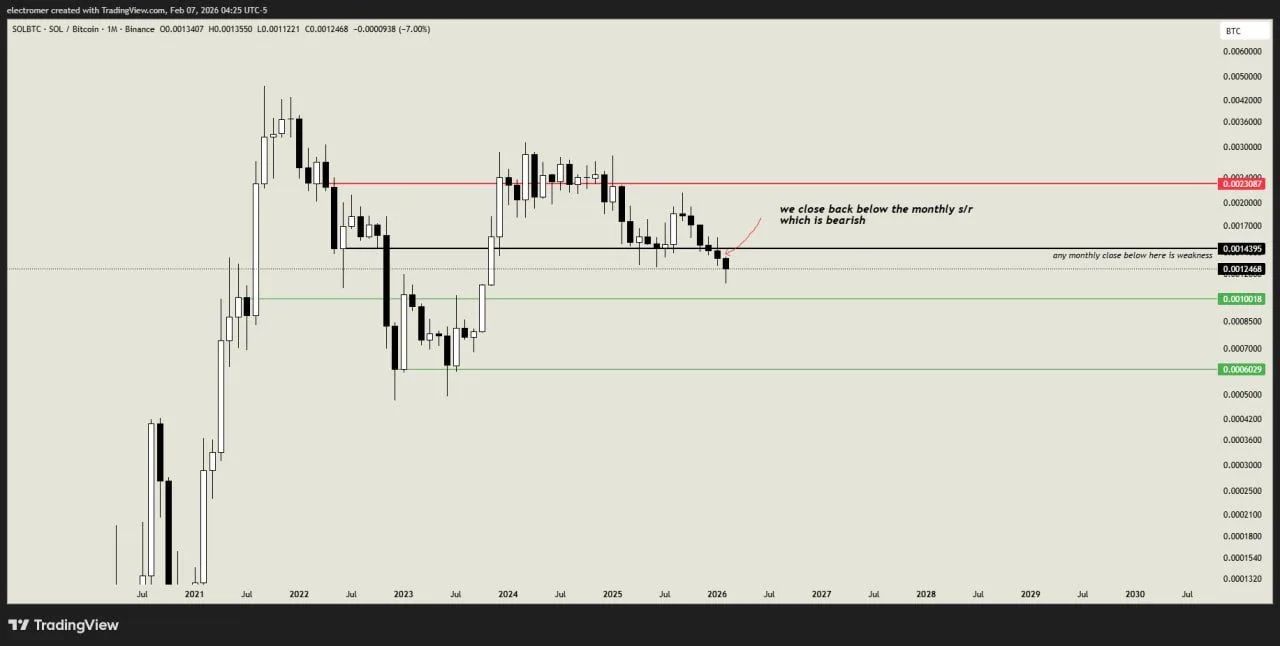
Solana Bitcoin Monthly Chart. Source: TradingView / X
Price also stayed far under the upper resistance band near 0.00231 $BTC. Prior attempts to push above that area stalled, and the latest structure shows another rollover after a short consolidation.
The chart highlights two downside levels if weakness persists. The first sits near 0.00101 $BTC, while a deeper support zone appears around 0.00060 $BTC. If $SOL/$BTC reclaims 0.00144 $BTC on a monthly close, the pair would shift back into the prior range and reduce the immediate bearish setup.
$SOL/$BTC tracks relative performance, not dollar price. A falling ratio signals Bitcoin outperforming Solana over the same period.
Solana Breaks Weekly Neckline as Head and Shoulders Pattern Signals More Downside Risk
Solana broke below a key neckline on the weekly chart after the latest selloff pushed $SOL under a long watched support zone, according to a TradingView graphic shared by Bitcoinsensus on X.
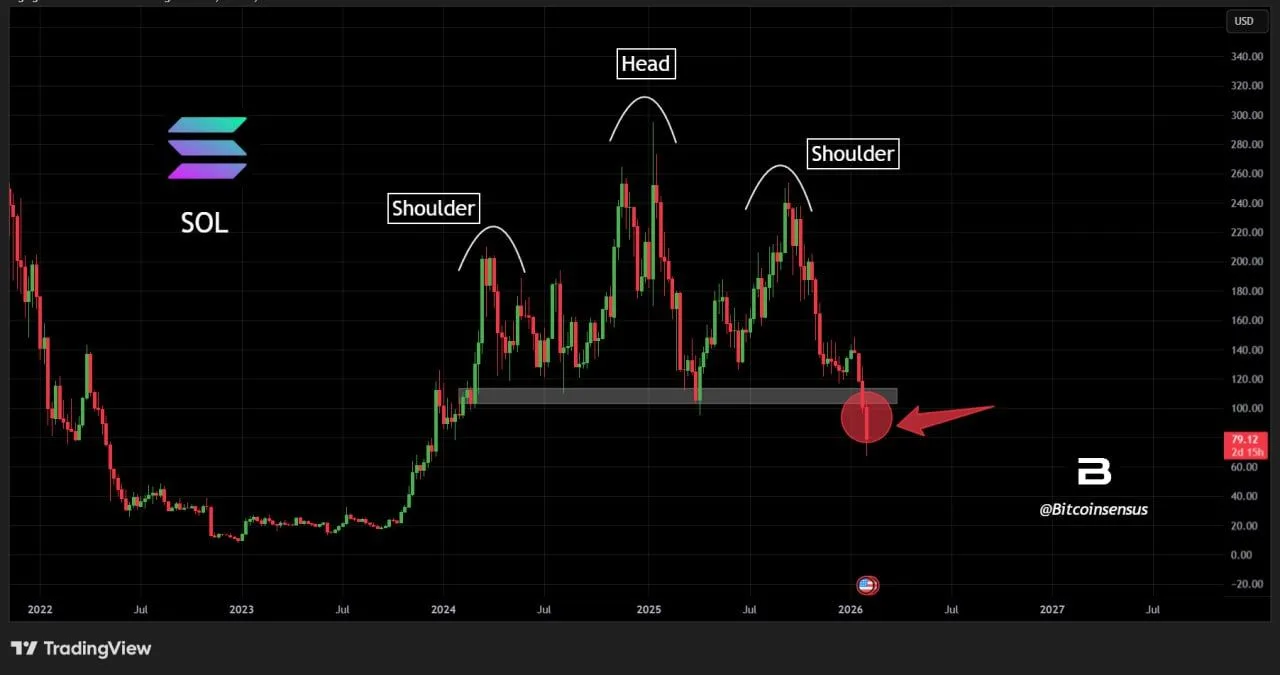
Solana Head and Shoulders Weekly Chart. Source: TradingView via Bitcoinsensus
The chart maps a multi year head and shoulders structure. It marks a left shoulder in 2024, a higher peak as the head in early 2025, and a right shoulder later in 2025. After that sequence, price slid into the neckline area and then fell through it, turning the former floor into overhead resistance.
The breakdown also aligns with a gray support band around the low $100s. The latest candles dipped under that zone and then printed a sharp lower wick, showing buyers reacted after the drop. Even so, price remained below the band at the time of the chart, keeping the focus on whether $SOL can reclaim that area on a weekly close.
$SOL last traded near $79 on the chart scale. A sustained move below the neckline typically shifts attention to prior demand zones from earlier cycles, while a recovery back above the neckline would weaken the immediate bearish setup.