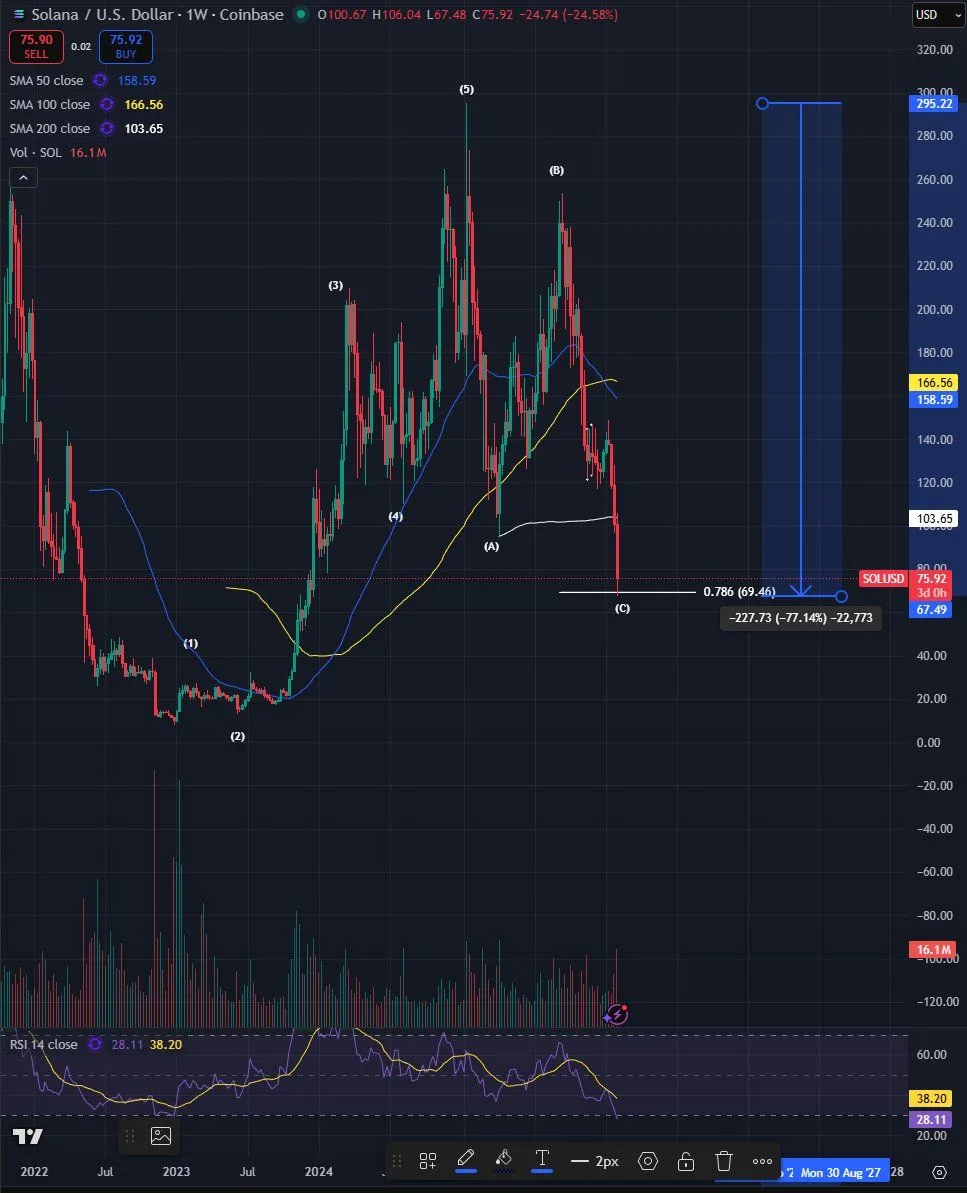
Solana U.S. Dollar Weekly Chart. Source: Bluntz on X
In a post on X, market analyst Bluntz said the 0.78 retracement from the all time high has now been hit and described the current zone as a long term buying area. The chart highlights a full retracement move from the prior peak near $295 to the recent low near $67, which reflects a drawdown of more than 70% from the cycle high.
Momentum indicators on the weekly chart remain weak. The relative strength index trends near oversold levels, while volume expanded during the selloff. At the same time, the failure to hold prior support near the 100 week average confirms a broader breakdown in structure, with price now consolidating near long term support levels.
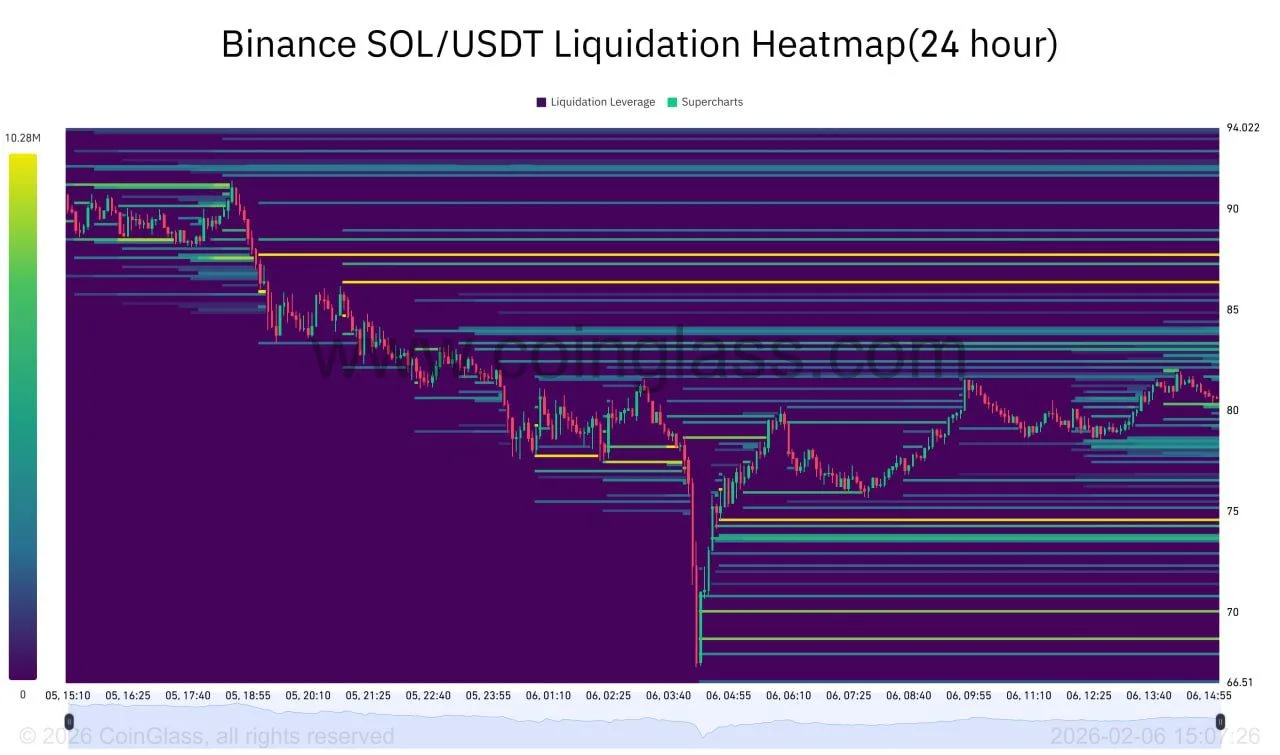
Binance $SOL/$USDT liquidation heatmap shows dense clusters near $75 and $85
Solana’s $SOL/$USDT liquidation heatmap on Binance shows large bands of forced liquidation interest stacked above and below current price over the past 24 hours, which points to crowded leverage around key levels.
Binance $SOL/$USDT Liquidation Heatmap (24 Hour). Source: CoinGlass
A CoinGlass heatmap shows $SOL sliding from the high $80s toward the low $70s before stabilizing near the mid $70s to low $80s range. The brightest liquidity bands sit near the $75 area on the downside and around $85 to $90 on the upside. Those zones mark where concentrated leveraged positions face liquidation risk if price moves into them.
After the sharp drop toward the low $70s, price rebounded and moved back into the $75 to $80 range. The rebound coincided with the clearing of downside liquidity, which often follows a fast liquidation sweep. At the same time, overhead heatmap bands remain intact above $85, which shows that short term upside moves could run into fresh liquidation clusters.
The structure on the heatmap reflects two sided leverage. Downside pools thinned after the flush, while upper bands stayed dense, which suggests that the near term path of least resistance remains capped by overhead liquidation zones.

 coinpaper.com