
Shiba Inu price today trades near $0.00000587 after rebounding from a session low at $0.0000050, its lowest level since early 2024. The bounce comes as Bitcoin crashes below $61,000, down over 50% from its all-time high of $126,080 reached just four months ago.
Spot Outflows Remain Modest At $1.14 Million
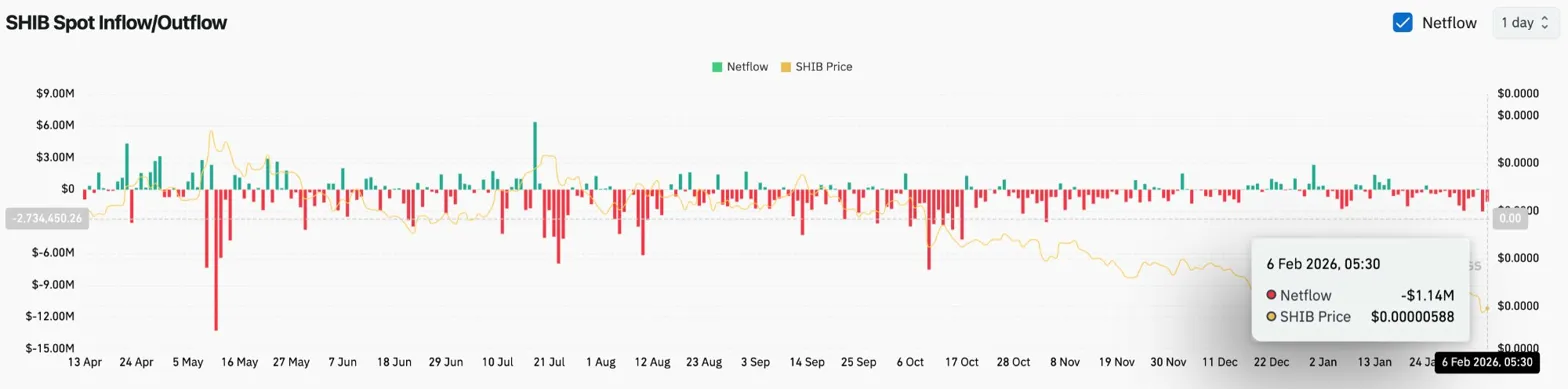
Coinglass data shows $1.14 million in spot outflows on February 6, a relatively contained figure given the market-wide panic. The modest outflow suggests $SHIB holders are not rushing to exit despite the crash, possibly indicating capitulation already occurred at higher levels.
The flow pattern through the past month shows consistent small outflows without the large distribution spikes seen in Bitcoin and Ethereum. When selling pressure is less severe than the broader market during a crash, it can indicate that weak hands have already exited.
Daily Chart Shows Multi-Month Support Test
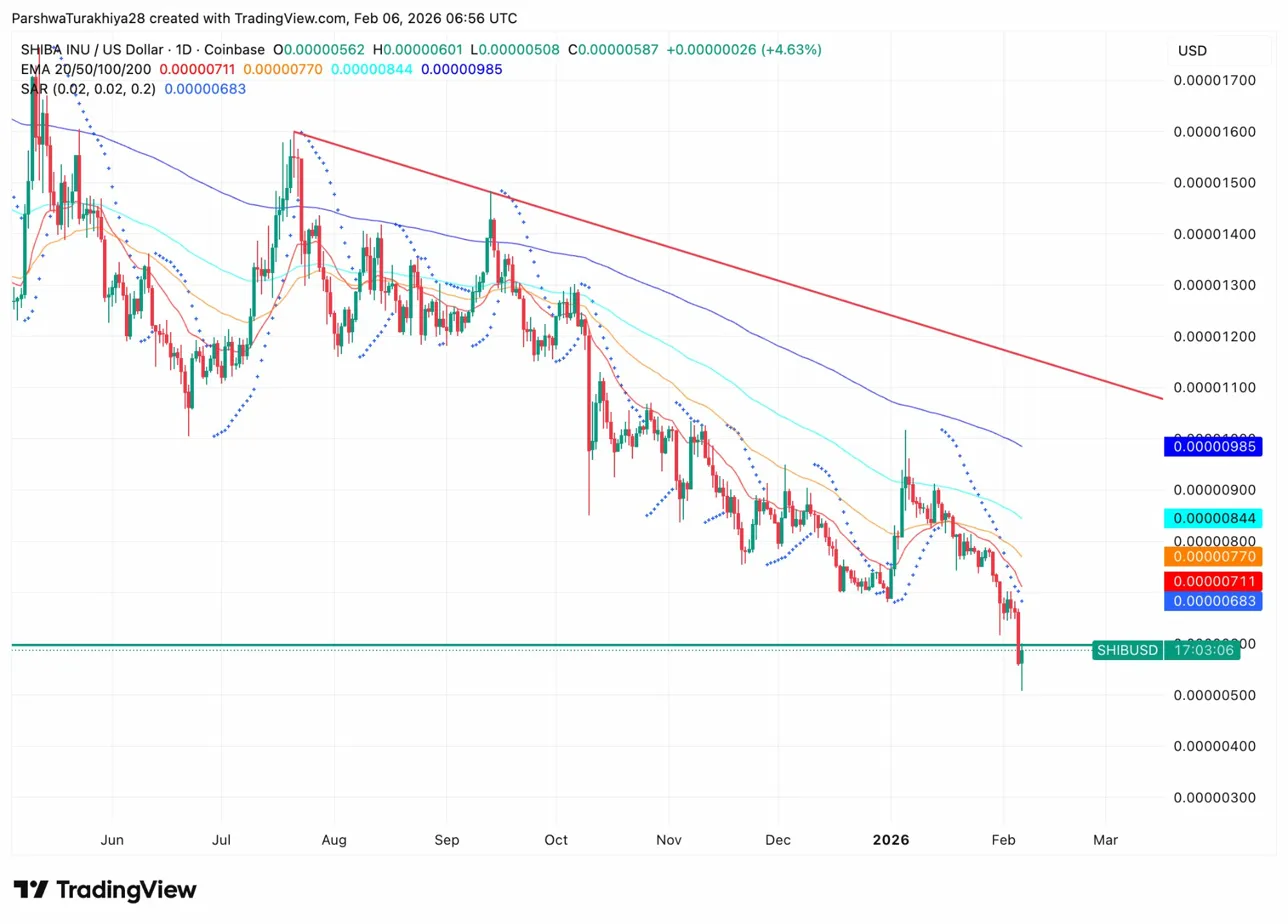
On the daily chart, Shiba Inu has crashed through multiple support levels to test the $0.0000050 zone that represents critical long-term support. Price trades well below all four major EMAs, with the 20 day at $0.00000711, the 50 day at $0.00000770, the 100 day at $0.00000844, and the 200 day at $0.00000985.
The Parabolic SAR sits at $0.00000683, marking the first resistance level for any recovery. The gap between current price at $0.0000058 and the nearest EMA at $0.0000071 shows how far the market has fallen from any meaningful technical resistance.
The current price represents a decline of over 60% from the August 2025 highs near $0.0000155. The $0.0000050 level represents the final major support before the 2024 accumulation zone near $0.0000040.
Bollinger Band Breakdown Shows Oversold Conditions
On the 2-hour chart, $SHIB crashed through the lower Bollinger Band at $0.0000054 during the February 5 selloff before recovering. The 20 period SMA sits at $0.0000061, marking immediate resistance for any bounce.
RSI dropped to 29.15 during the crash, deeply oversold territory that historically precedes at least a relief bounce. The indicator has recovered slightly to 37.41 as price stabilizes above $0.0000058.
The Bollinger Bands have expanded significantly during the crash, reflecting increased volatility. The upper band at $0.0000069 represents the first meaningful resistance zone, aligning with the lower boundary of the previous consolidation range.
Bitcoin Collapse Drags Entire Market Lower
The broader crypto selloff has reached historic proportions. Bitcoin fell below $70,000 for the first time in over a year before accelerating losses that pushed price to $60,256, levels not seen since October 2024.
The collapse stems from multiple converging factors. Geopolitical instability around the U.S. capture of Venezuelan President Nicolas Maduro and Trump’s Greenland threats pushed investors toward traditional safe havens. Gold and silver surged to historic highs while crypto bled.
Trump’s nomination of Kevin Warsh for Federal Reserve Chair added to the pressure despite Warsh’s positive view on cryptocurrency. Deutsche Bank analysts attributed the slide to massive withdrawals from institutional ETFs, while a concurrent tech stock selloff sent the Nasdaq down 4.8% in a week.
$SHIB has fallen in sympathy with the broader market but shows relative resilience on the bounce, recovering 15% from intraday lows while Bitcoin struggles to hold $65,000.
Outlook: Will Shiba Inu Go Up?
The trend remains firmly bearish while Bitcoin continues falling, but the $0.0000050 support test offers potential for a relief bounce.
- Bullish case: A daily close above $0.00000711 would reclaim the 20 day EMA and signal that the crash low is holding. That move requires Bitcoin stabilization above $65,000 and a return of risk appetite to speculative assets.
- Bearish case: A close below $0.0000050 would break the 2024 support structure and expose the $0.0000040 demand zone. With Bitcoin down 50% from highs and no meme coin catalyst in sight, that scenario remains probable if macro selling continues.
Disclaimer: The information presented in this article is for informational and educational purposes only. The article does not constitute financial advice or advice of any kind. Coin Edition is not responsible for any losses incurred as a result of the utilization of content, products, or services mentioned. Readers are advised to exercise caution before taking any action related to the company.