$XRP price has started showing early signs of stabilization after a sharp sell-off over the past 24 hours. The token recently broke down from its long-term falling channel and briefly slipped below its realized price, a level that reflects the average cost of all circulating coins. After dropping toward $1.11, $XRP has rebounded toward the $1.30 area.
On the surface, this looks like a strong bounce. In past cycles, similar conditions have appeared close to major turning points. However, historical data shows that $XRP often spends long periods consolidating around these levels before a true recovery begins. Current on-chain and technical indicators suggest that while selling pressure is rising, the market may not have fully reset yet.
Breakdown From the Falling Channel Pushes $XRP Into a High-Risk Zone
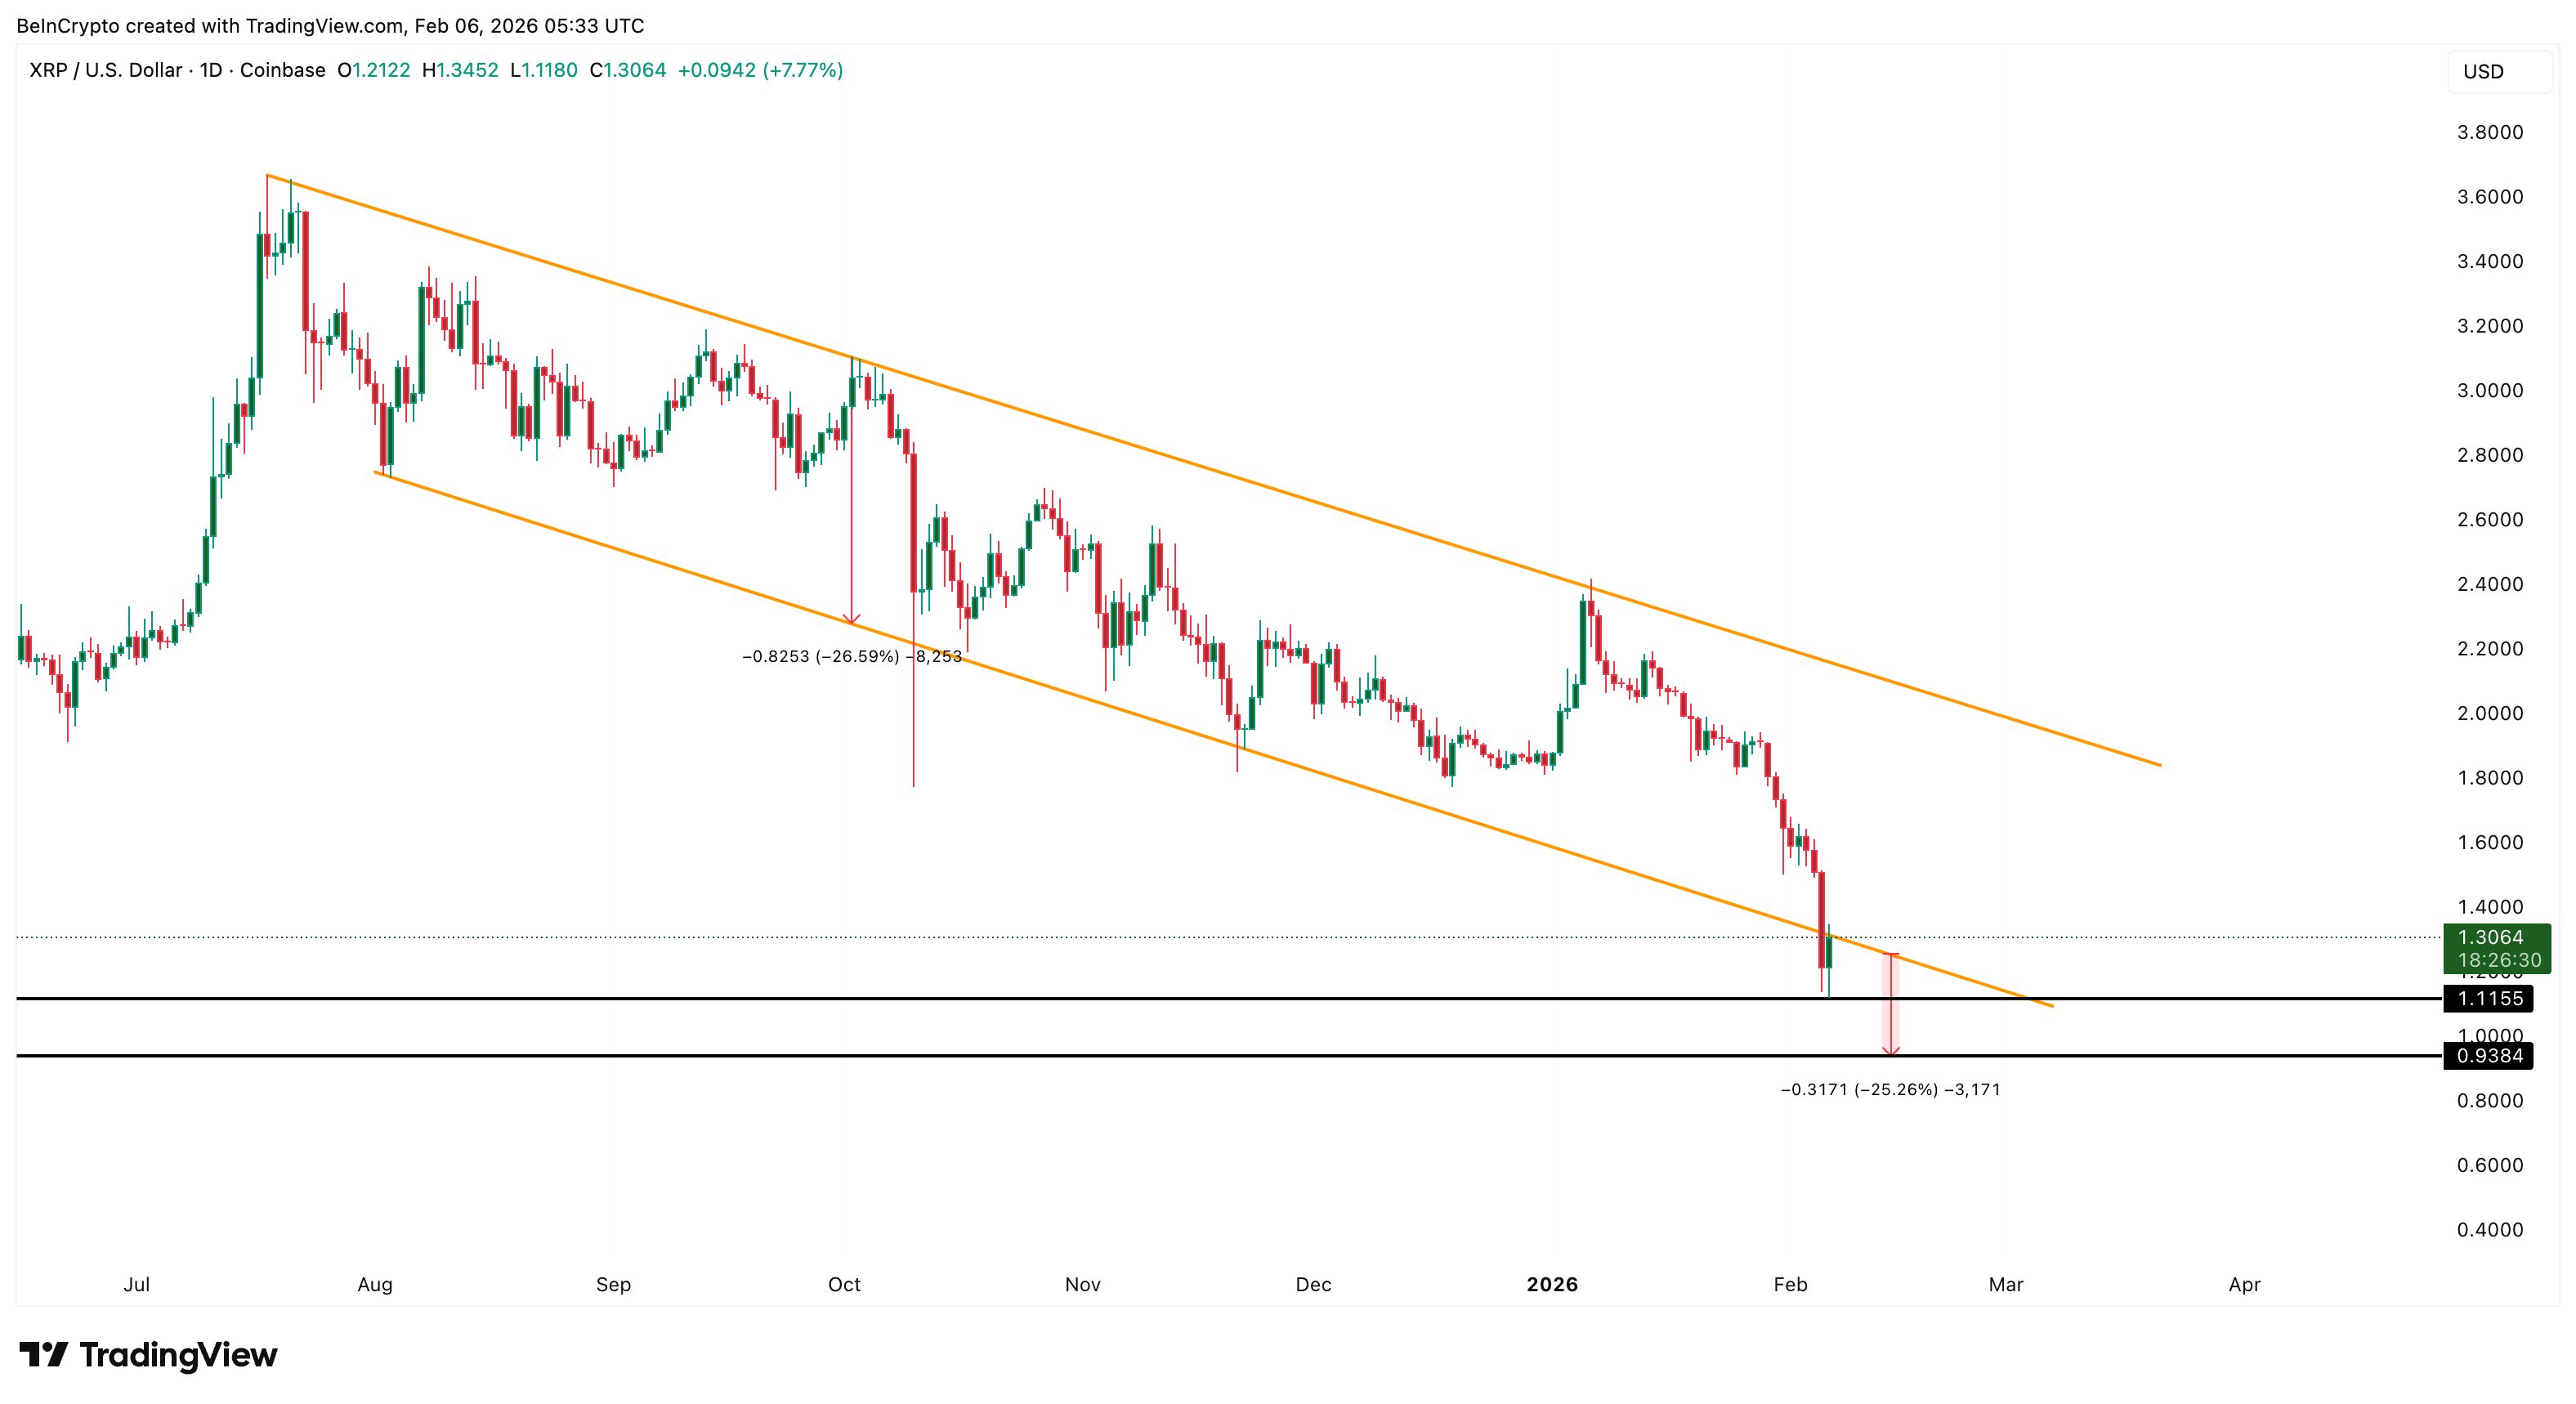
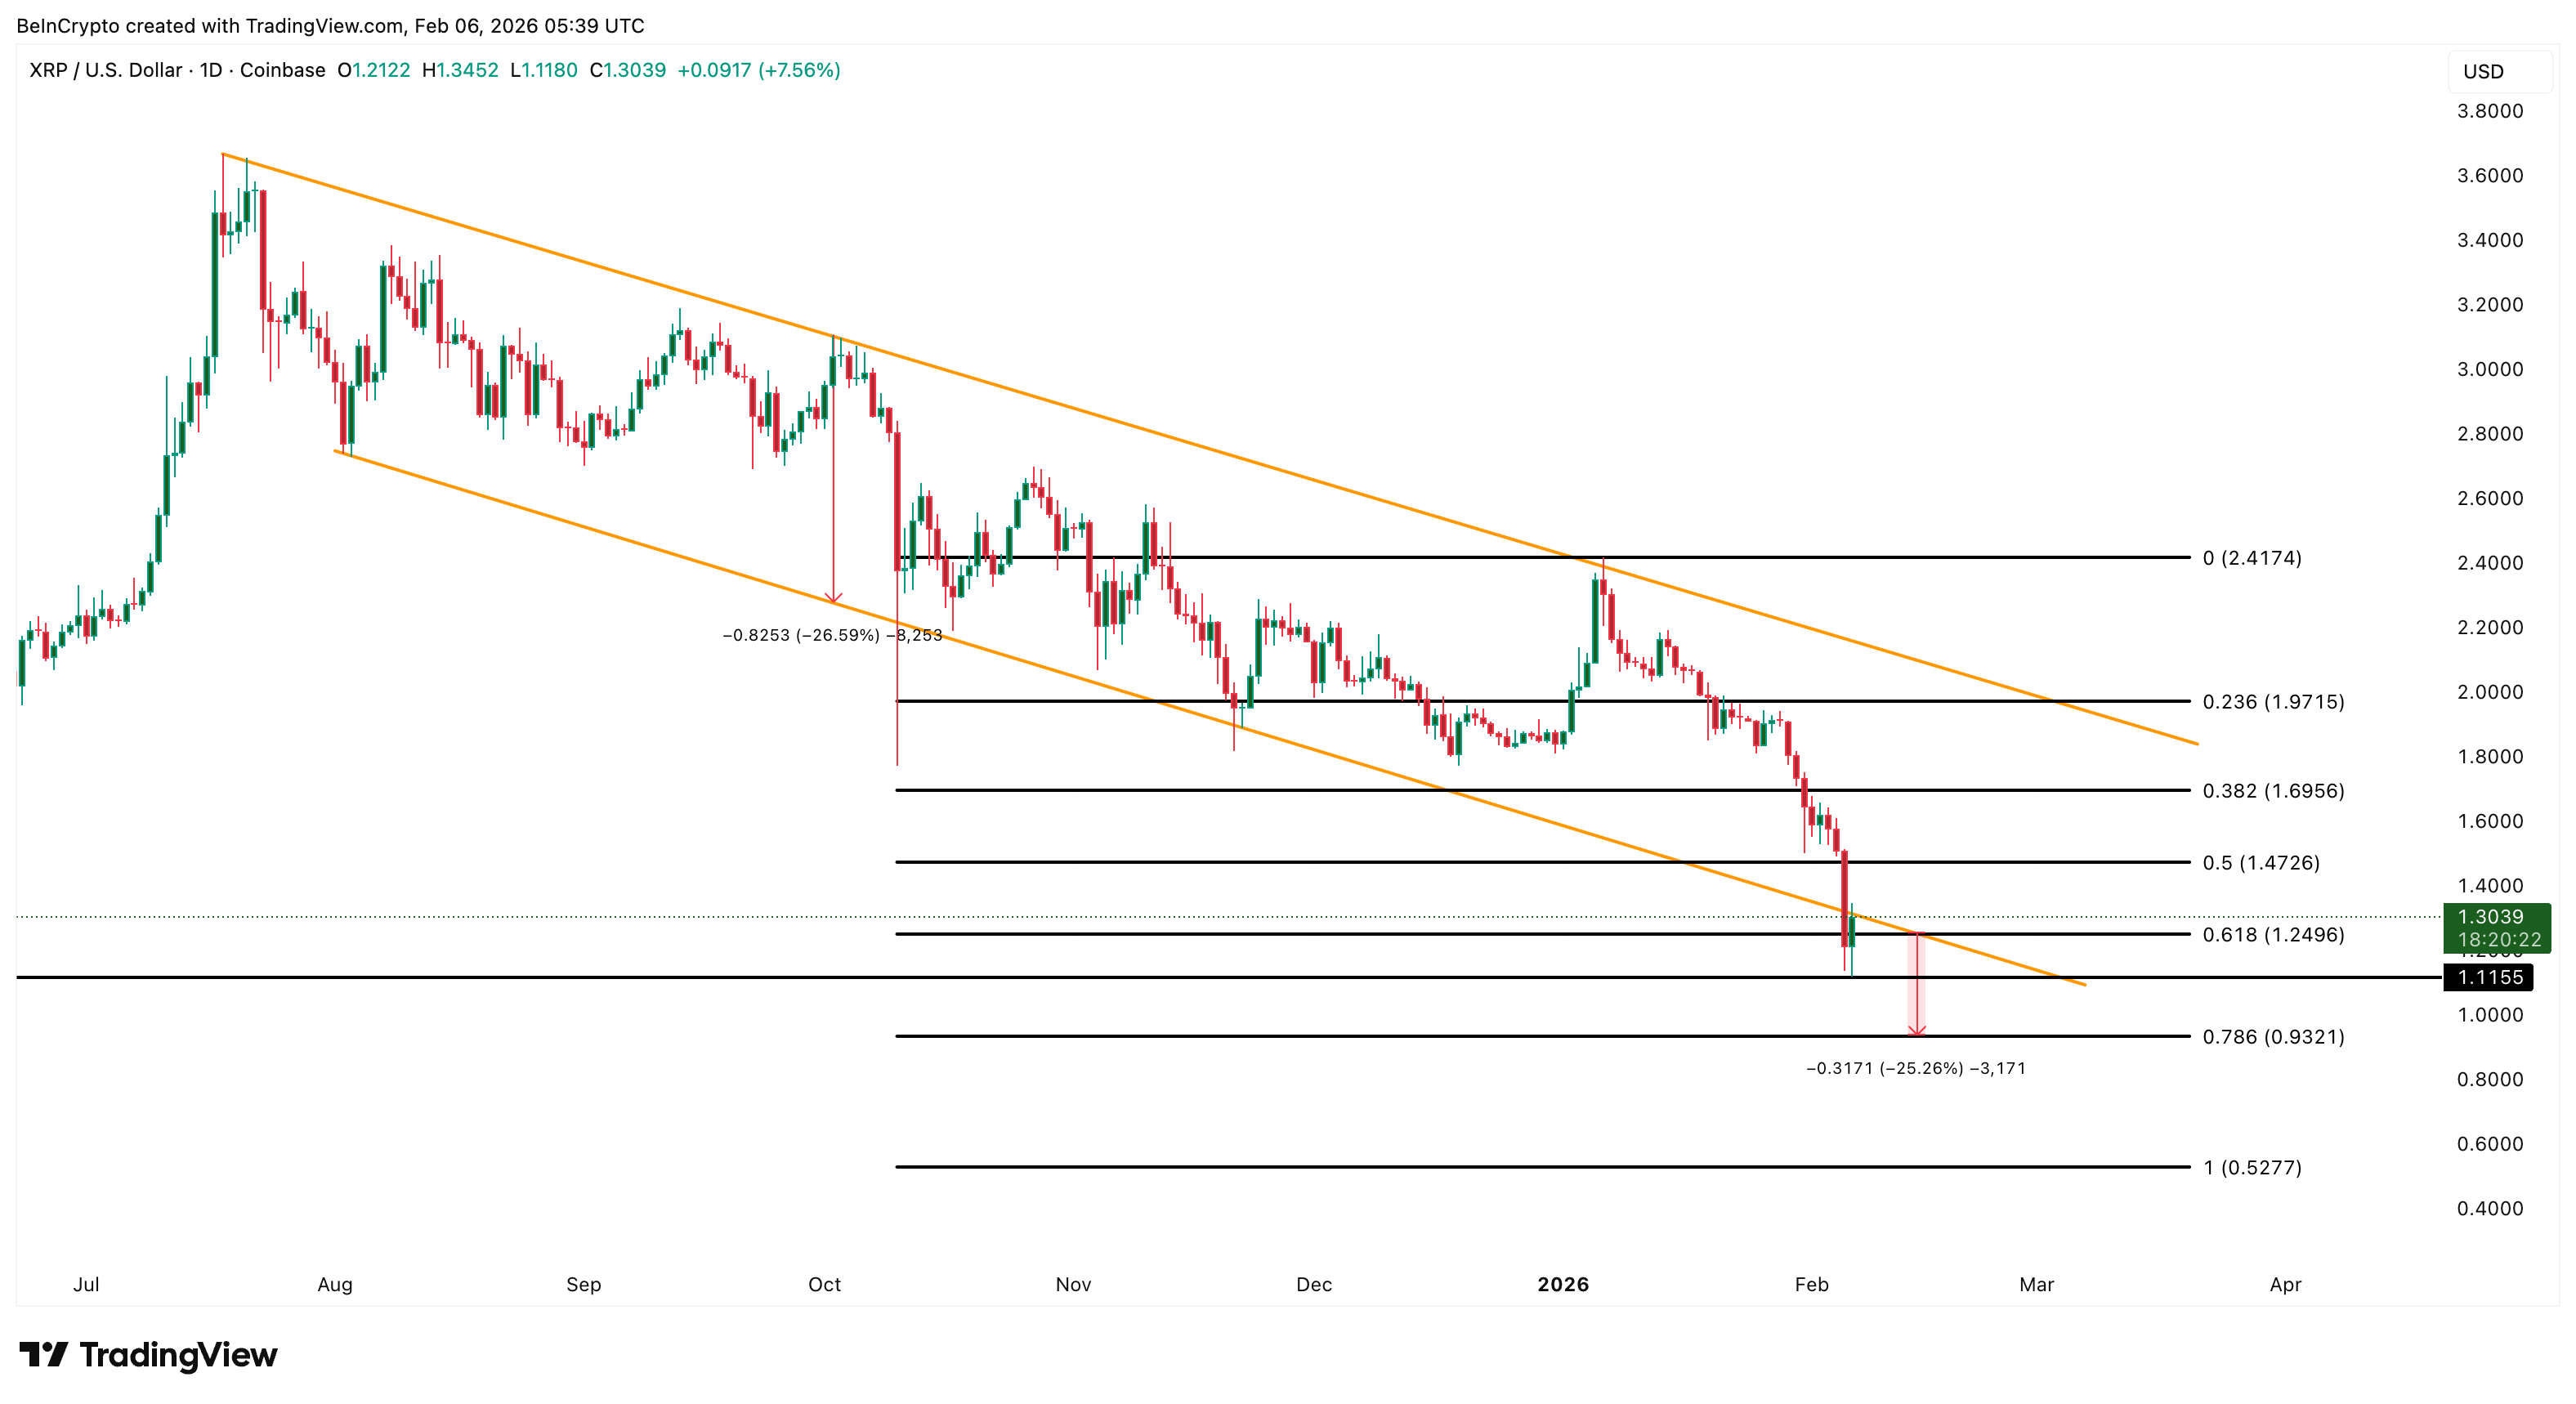
$XRP’s decline accelerated between February 4 and February 6, when the price broke decisively below its falling channel. This channel had guided price lower since mid-2025, forming a clear pattern of lower highs and lower lows.
After losing the lower trendline support, $XRP slid toward its projected downside zone near $0.93 and briefly touched $1.11. Although price has bounced since then, the broader structure remains weak.
Want more token insights like this? Sign up for Editor Harsh Notariya’s Daily Crypto Newsletter here.
 $XRP Price Structure">
Similar breakdowns in past cycles have rarely marked immediate bottoms and immediate recoveries.
Realized Price History Shows Why This “Bottom Zone” Can Last for Years
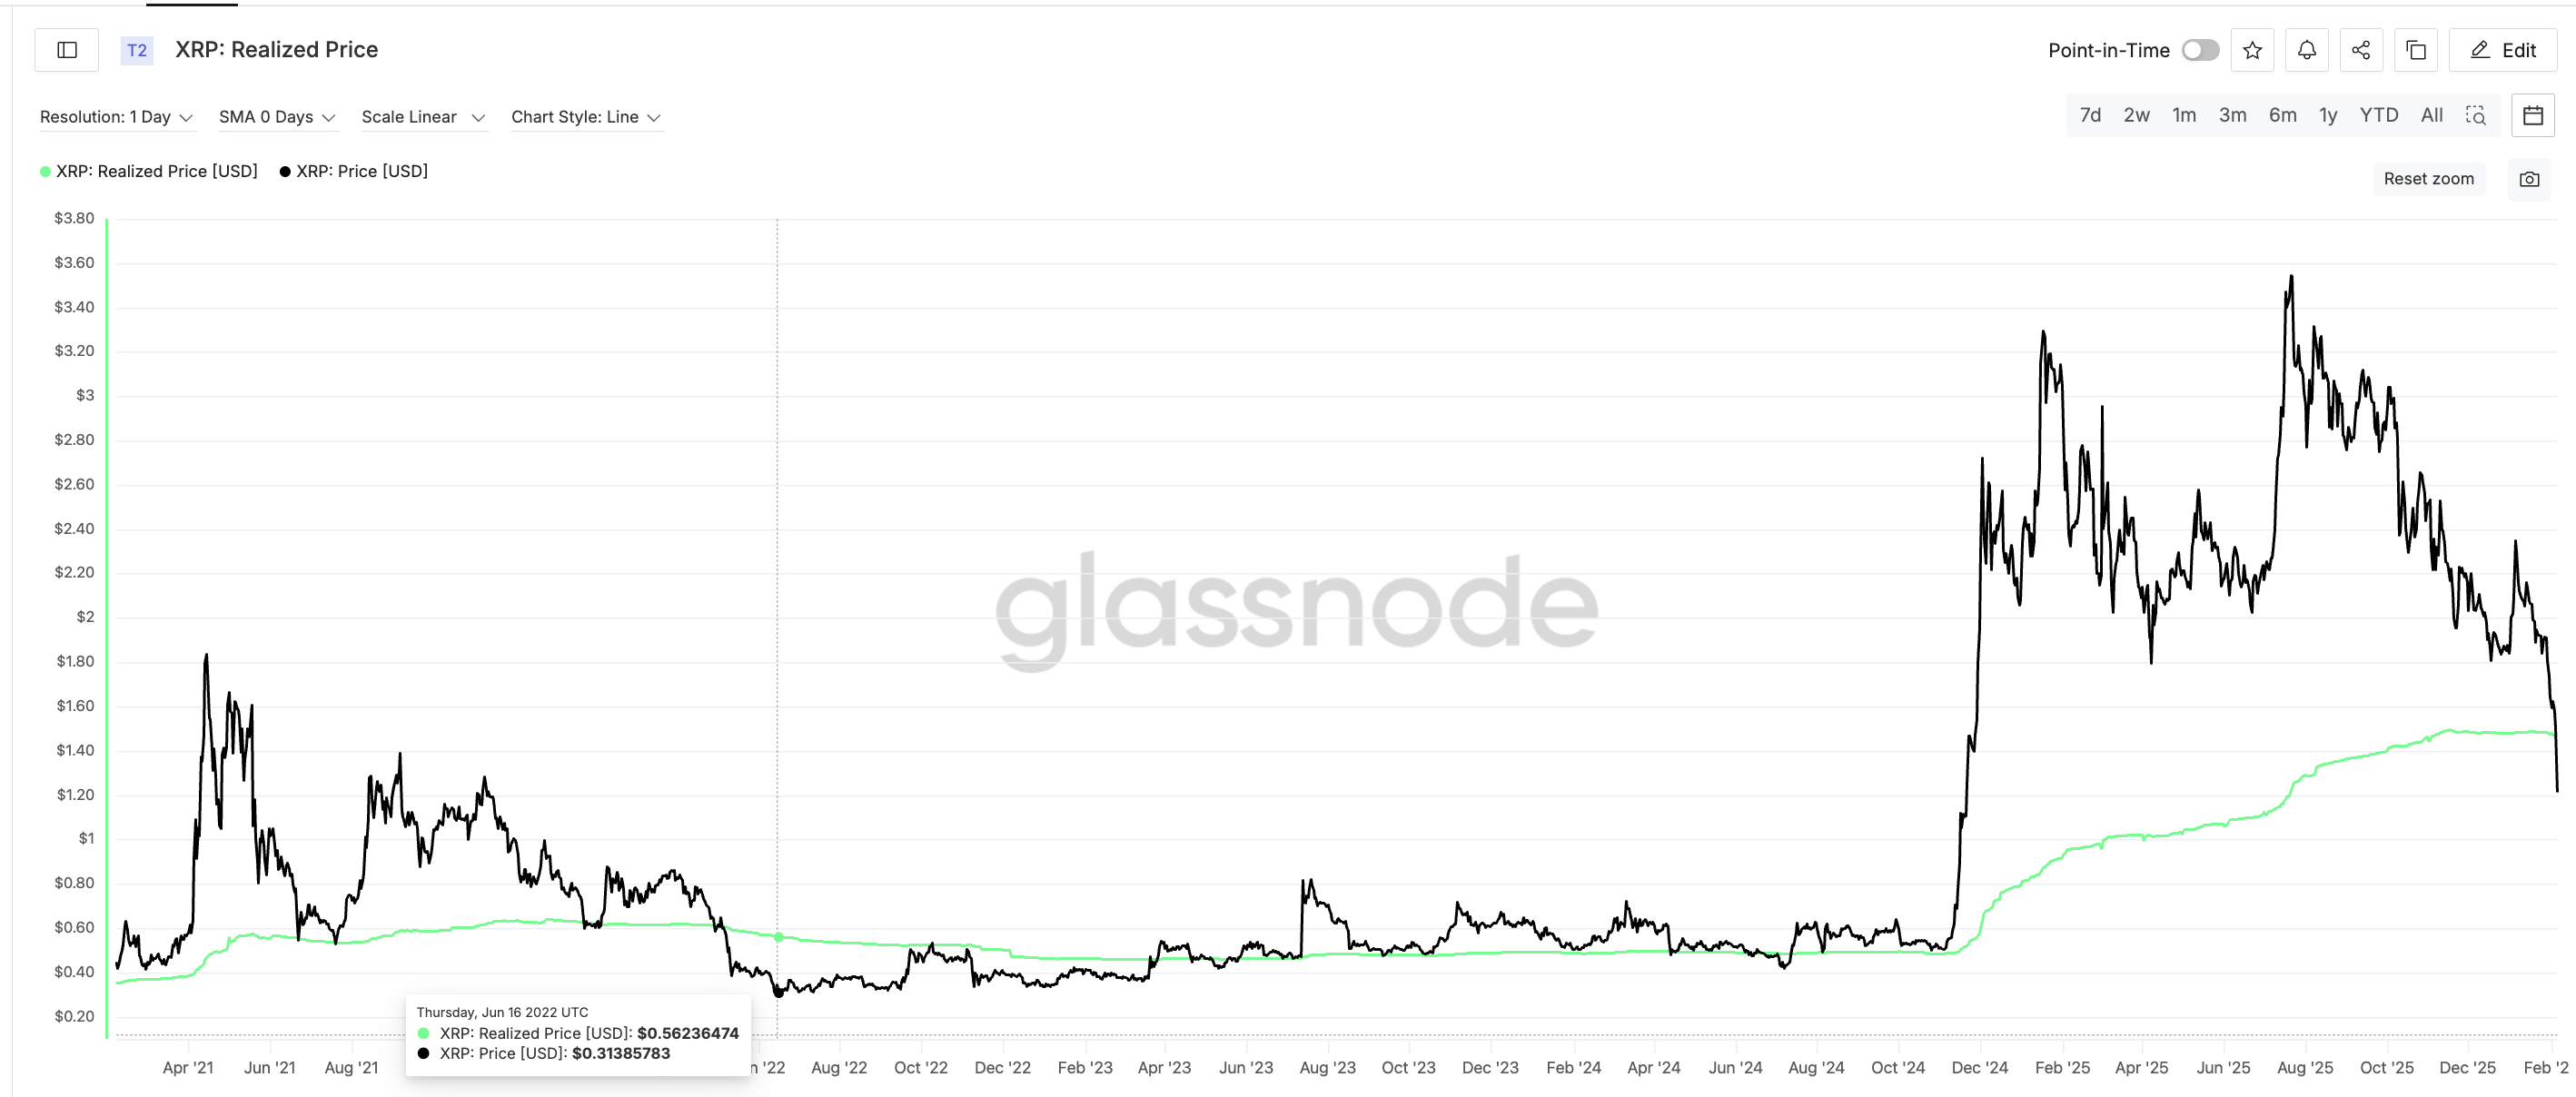
In mid-2022, $XRP lost major support, the realized price line, and entered a prolonged bearish phase. After that breakdown, the price continued drifting lower and sideways for more than two years before the late-2024 rally began.
This pattern shows that large structural breaks usually lead to long stabilization phases, not instant reversals. The current rebound toward $1.30 has not yet changed that pattern.
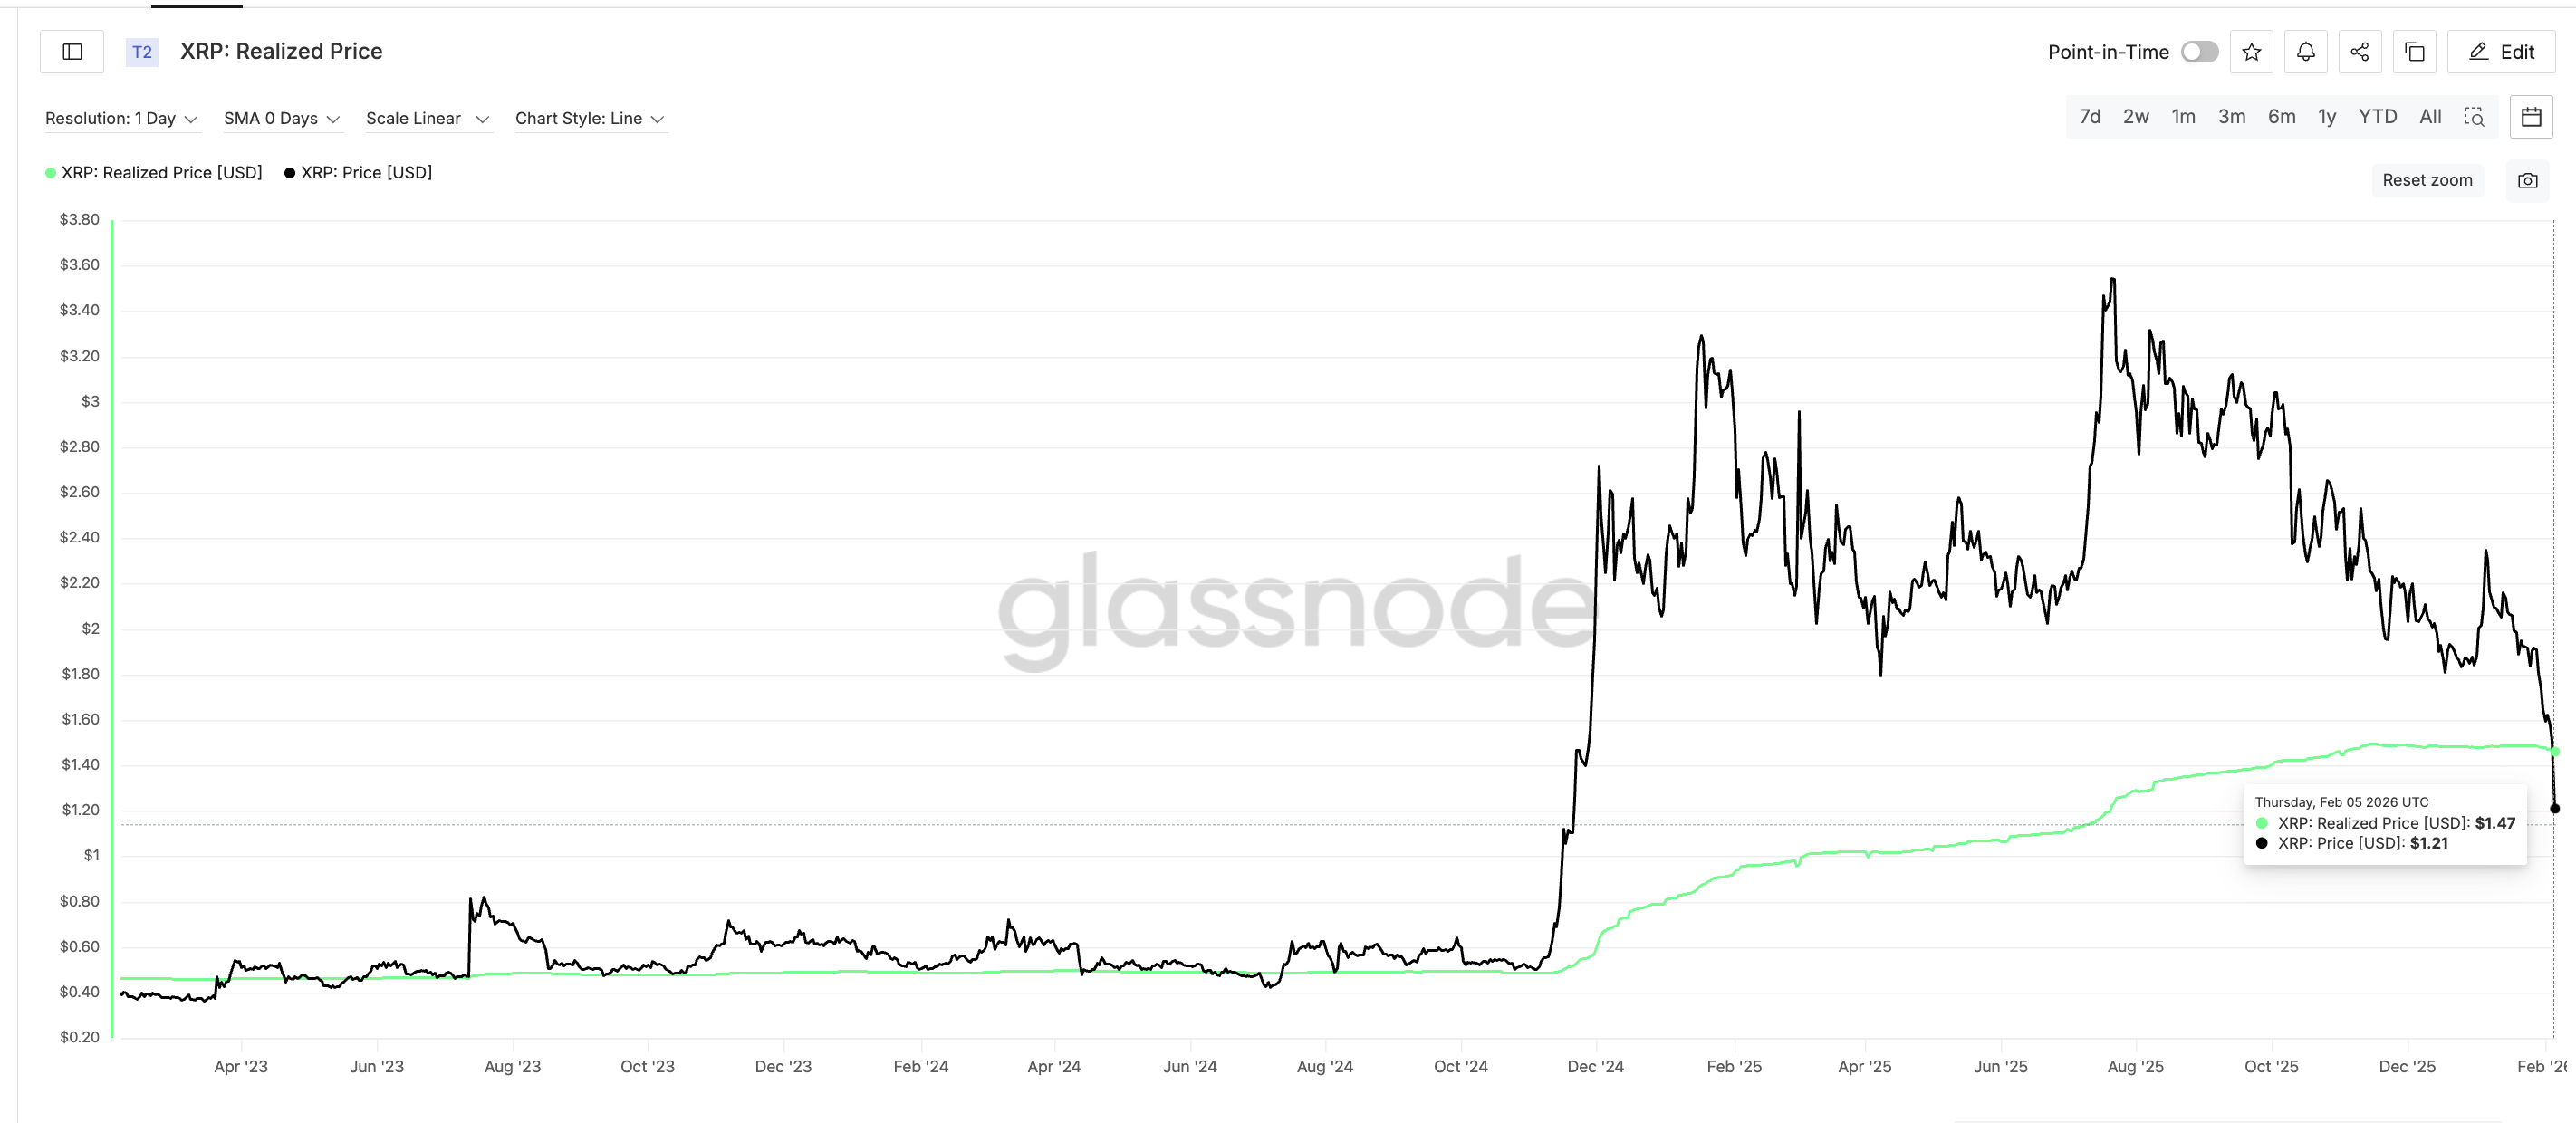
During the recent sell-off, $XRP briefly fell below its realized price, which currently stands near $1.47. Realized price represents the average purchase cost of all circulating tokens. When the market price trades below this level, most holders are sitting at a loss.
This condition often marks periods of financial stress, but not necessarily final bottoms.
A clear example comes from 2022.
In June 2022, $XRP traded near $0.31 while its realized price was close to $0.56. That represented a decline of nearly 46% below the realized price. Despite this deep discount, $XRP did not start a bull market. Instead, it entered a prolonged bear phase.
From mid-2022 through November 2024, $XRP repeatedly traded close to its realized price, often closing just above or below it. This “hugging the line” phase lasted more than two years. Only after this extended period of consolidation did the major rally toward $3.54 begin.
Compared to that cycle, today’s situation looks milder.
Current price near $1.21–$1.30 is only about 18% to 25% below the $1.47 realized price. In 2022, the discount was almost double that. This suggests that stress is building, but full long-term capitulation has likely not occurred yet.
Long-Term Holder Behavior Supports The ‘Realized Price’ Angle
Long-Term Holder Net Unrealized Profit/Loss, or NUPL, currently sits near -0.19. This shows that many long-term $XRP holders are now at a loss. However, during major cycle bottoms, this metric has historically fallen deeper, even to around -0.31 (in early 2023), before stabilizing.
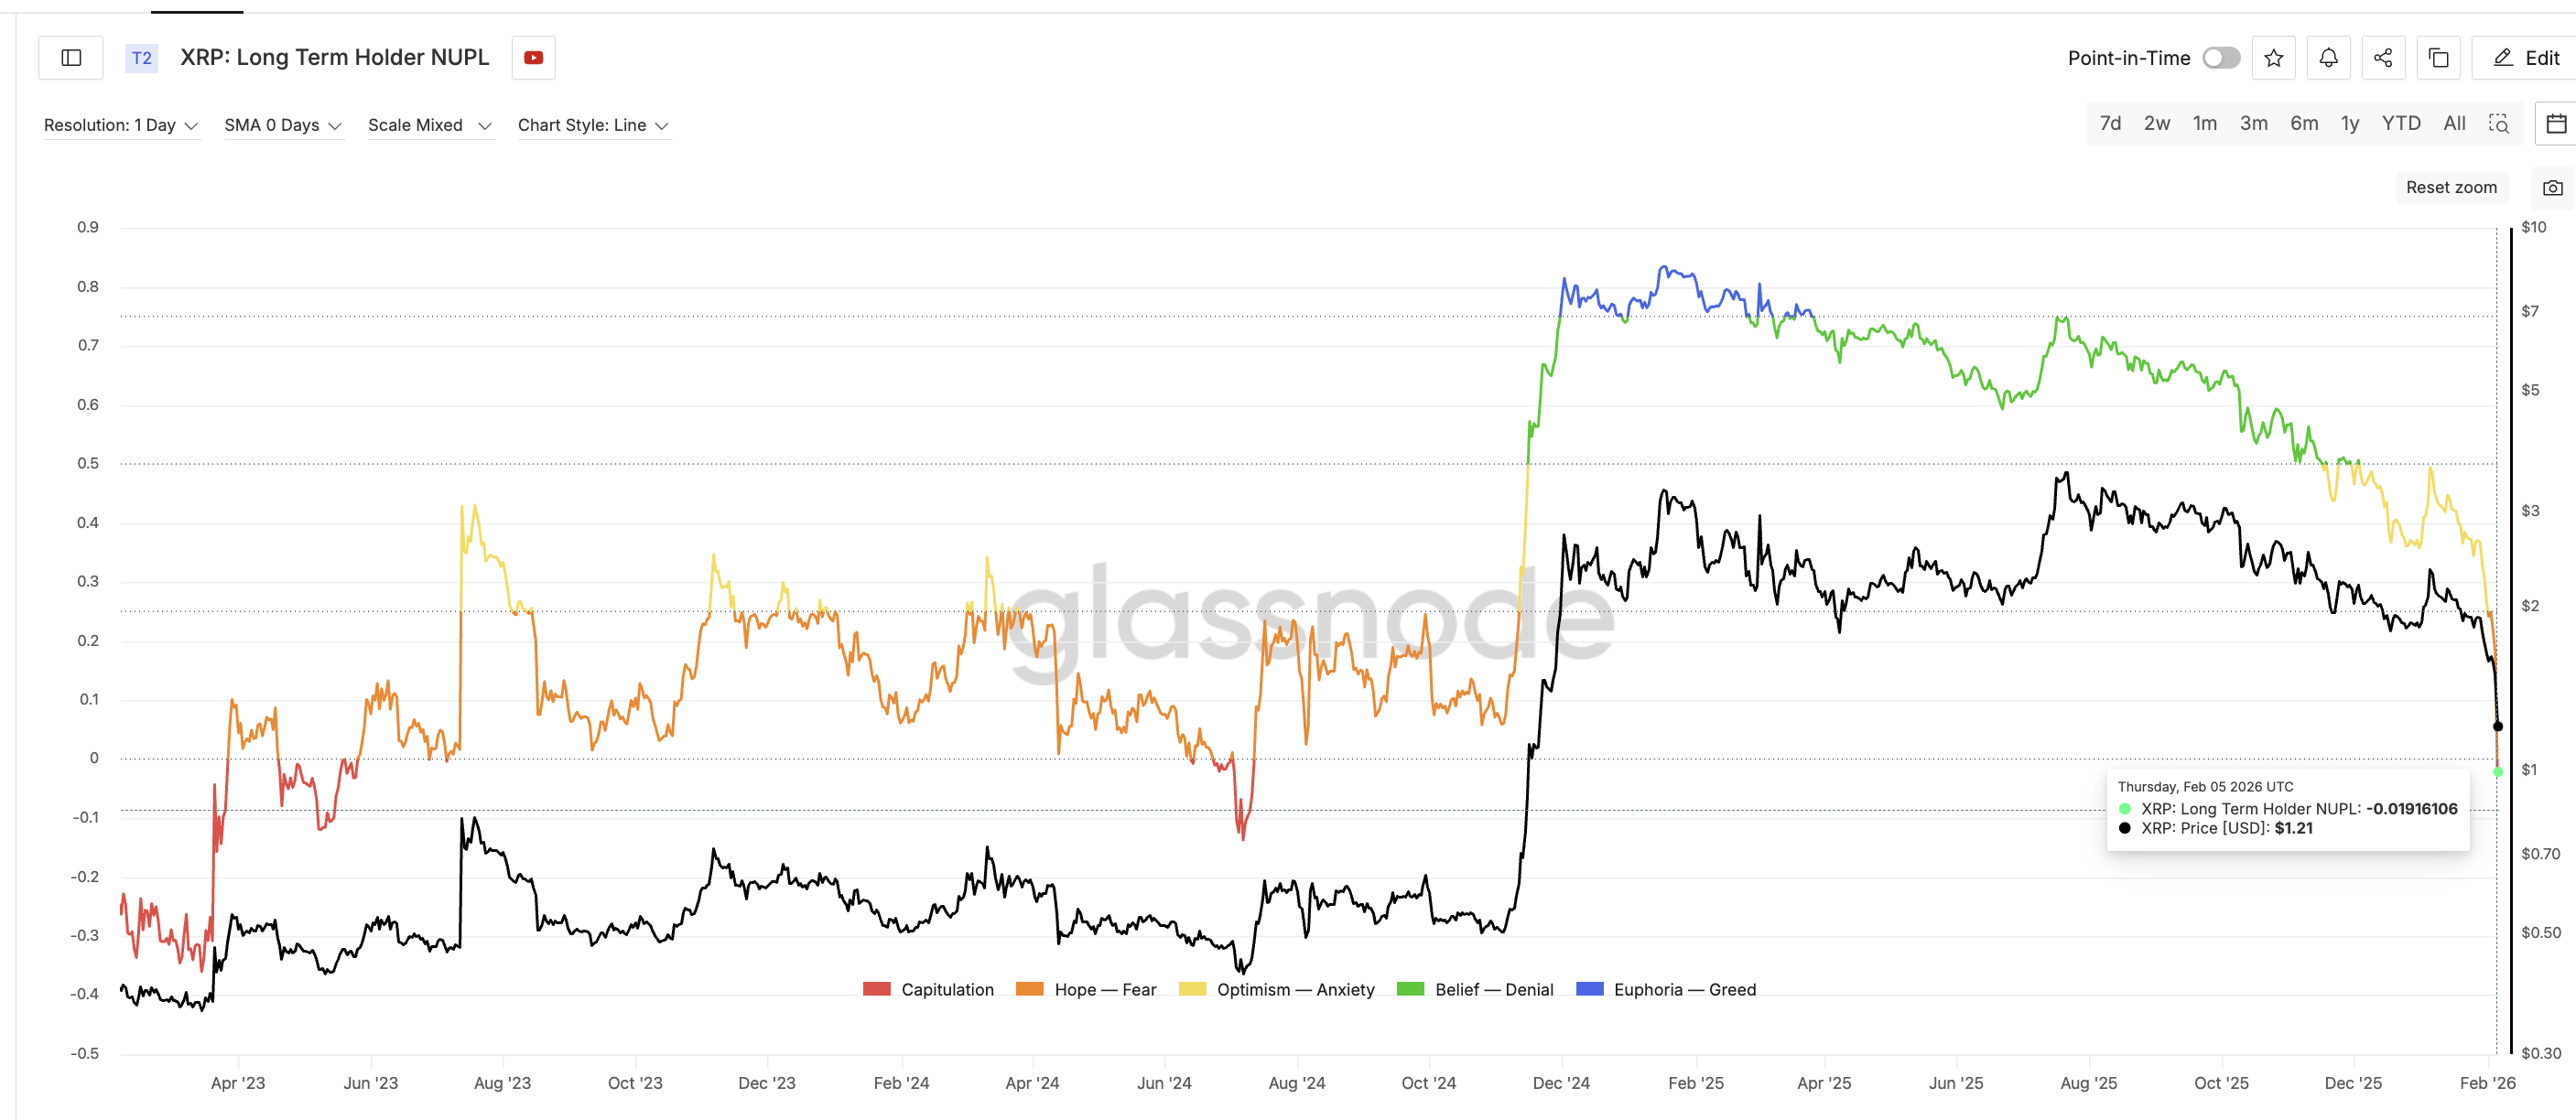
So while holders are under pressure, past cycles suggest this phase may still have room to develop.
At the same time, spent coin activity has surged. Since February 4, the spent coins age band metric, showcasing distribution-linked coin activity, has risen from about 79 million to more than 198 million, a 150% surge. This indicates that previously inactive coins are moving, often toward exchanges. In strong bottoming phases, this metric usually declines as selling dries up. The current spike, visible even after the price crash, suggests distribution is still ongoing.
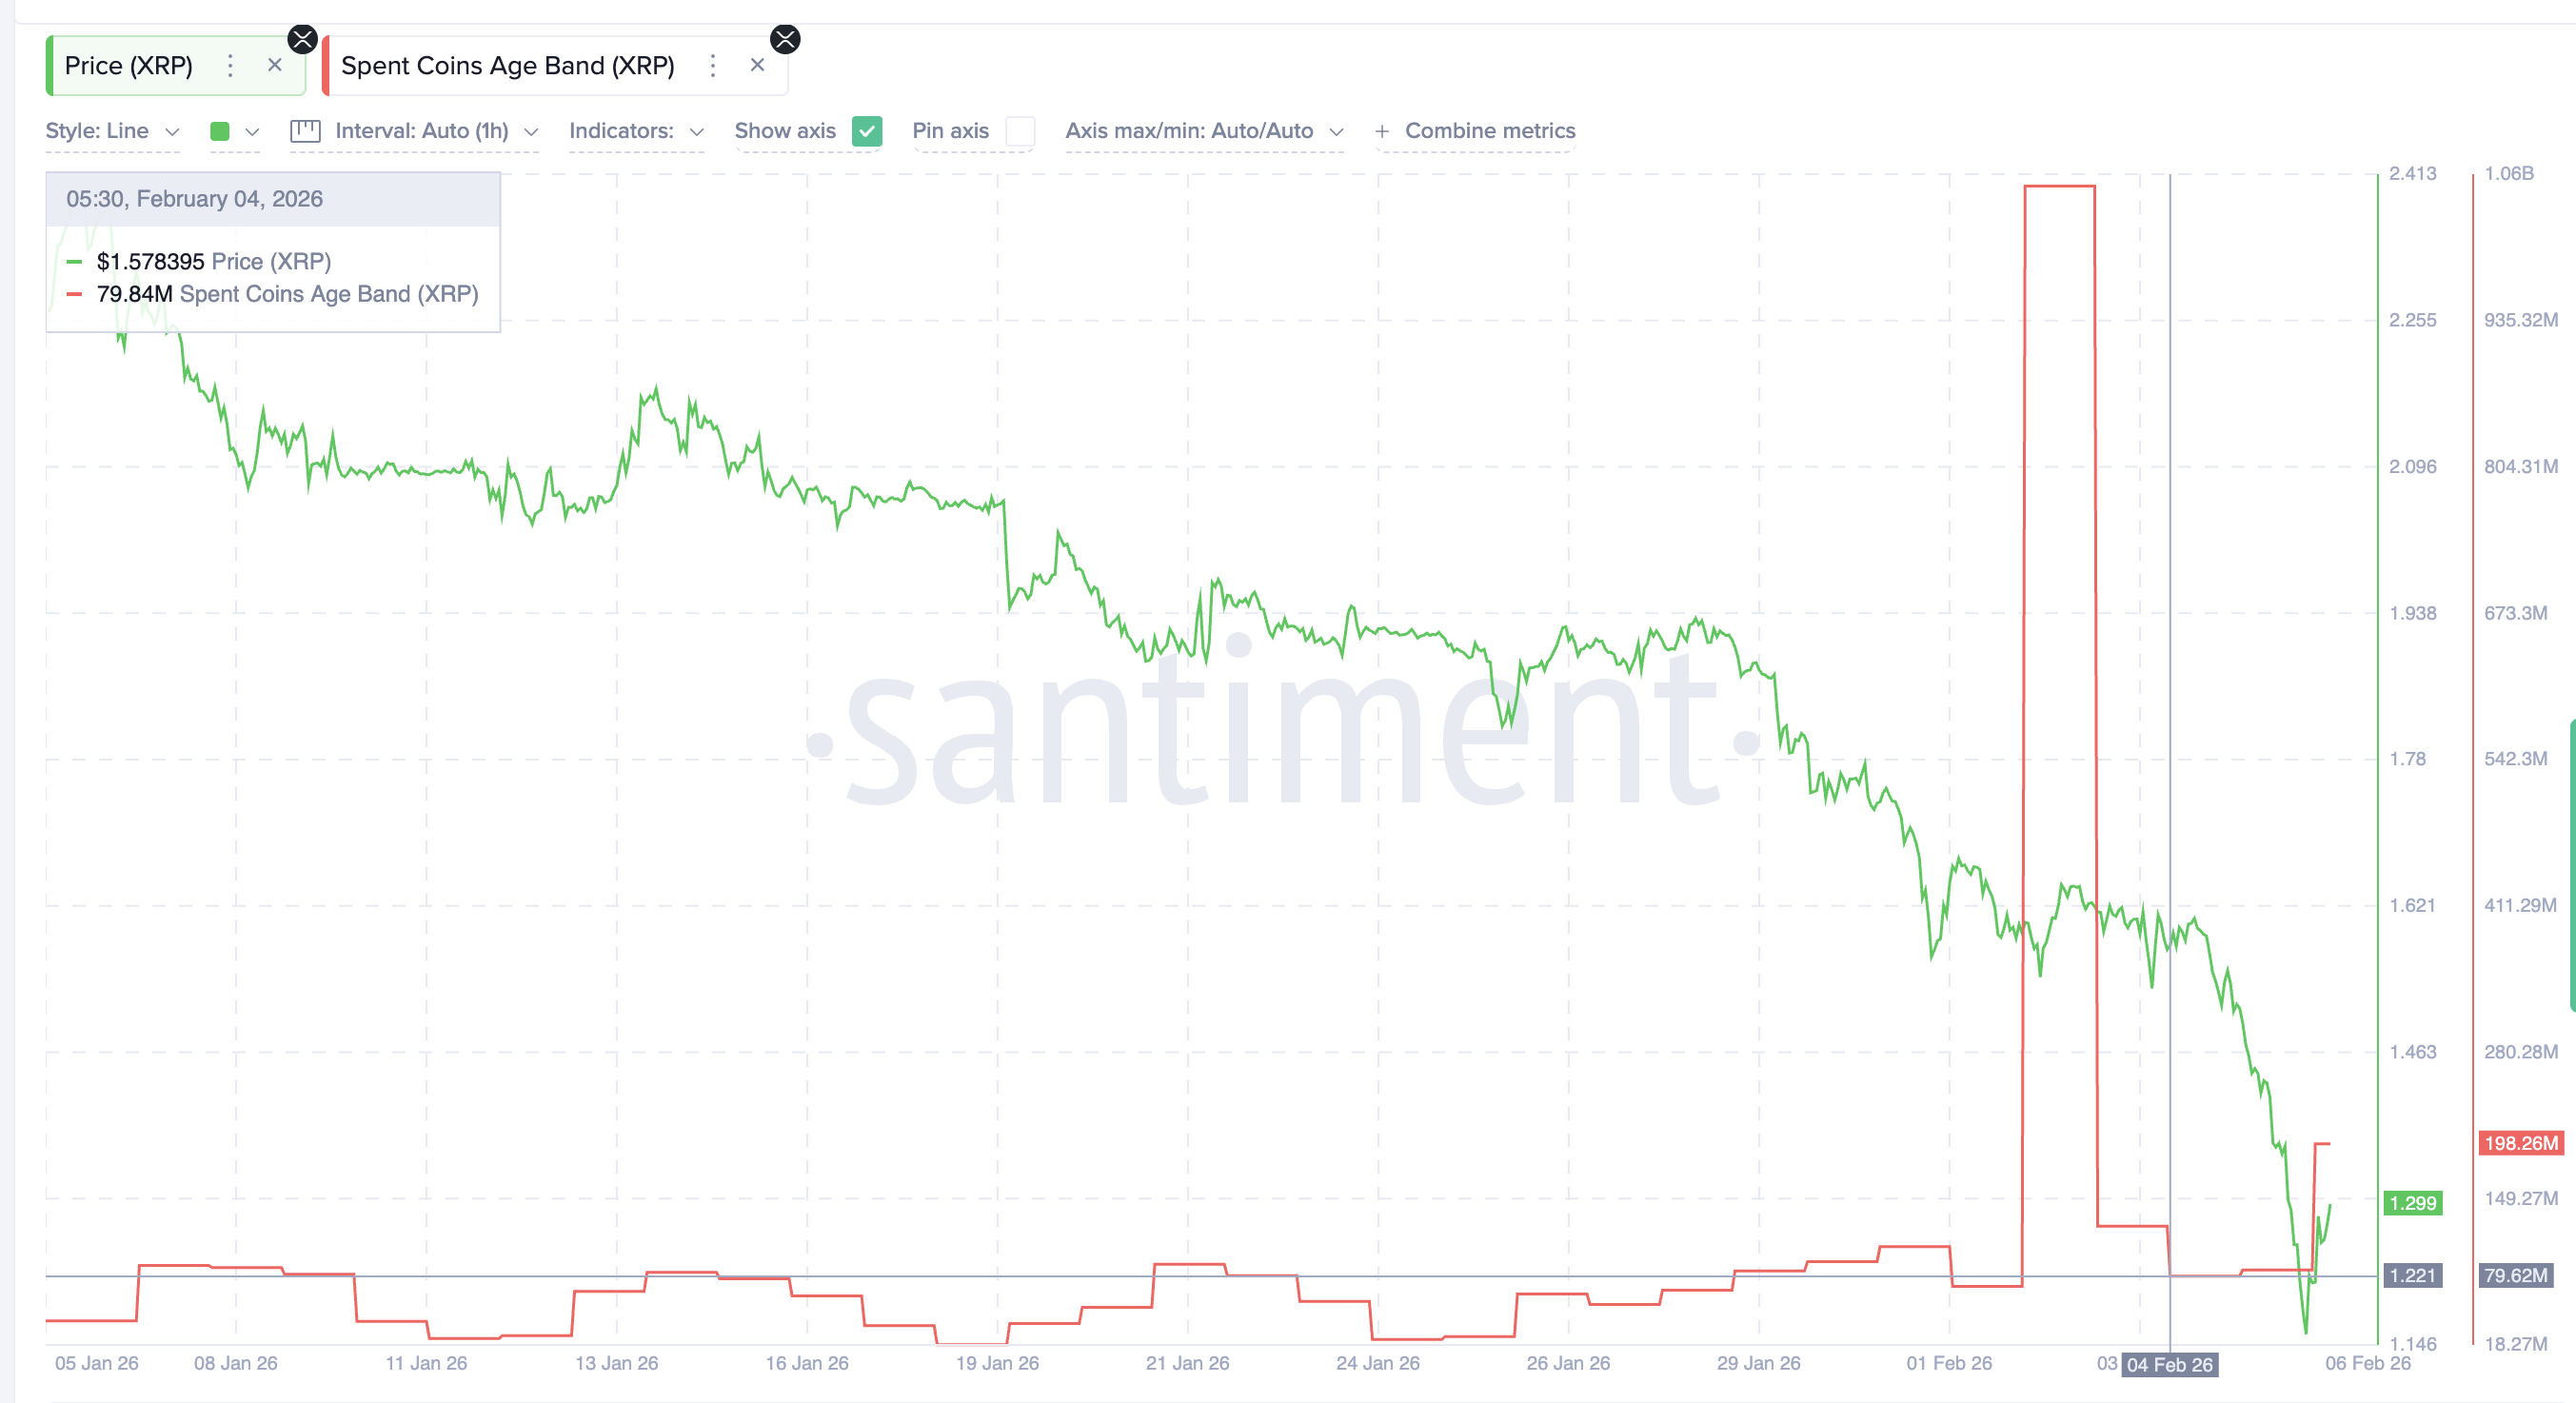
A similar surge in early February was followed by another leg down, reinforcing that repositioning is not finished.
Together, realized price history, NUPL, and rising coin movement show that $XRP is in a stress zone, not yet in a confirmed accumulation phase.
$XRP Price Structure Shows Why $0.93 Remains the Key Test
All of these on-chain signals feed back into the price structure. $XRP remains below its broken channel and below the realized price. This keeps downside risks elevated.
The next major support sits near $0.93. This level aligns with channel projections and Fibonacci retracement zones, making it a critical area where buyers may attempt to defend the price.
If $0.93 fails, the next major downside zone appears near $0.52, which served as a long-term base during the 2022–2023 bear market.
 $XRP Price Analysis">
On the upside, the $XRP price must first reclaim $1.47 to restore holder confidence. A move above $1.69 and $1.97 would be needed to improve the medium-term structure.
Until the realized price is reclaimed while NUPL stabilizes and spent-coin activity remains low for a significant period, all $XRP price bounces are likely to face renewed selling pressure.
The post $XRP Price Flashes a Potential Bottom? Yet History Warns Against Early Optimism appeared first on BeInCrypto.