This crash wiped out over $860 billion in market value during the week, marking one of the largest value losses in crypto history.
Following the momentum, Chainlink price gave a decisive correction from $11.13 to current trading value of $7.85, registering a loss of nearly 30%. Consequently, the asset market cap tumbled to $5.2 billion.
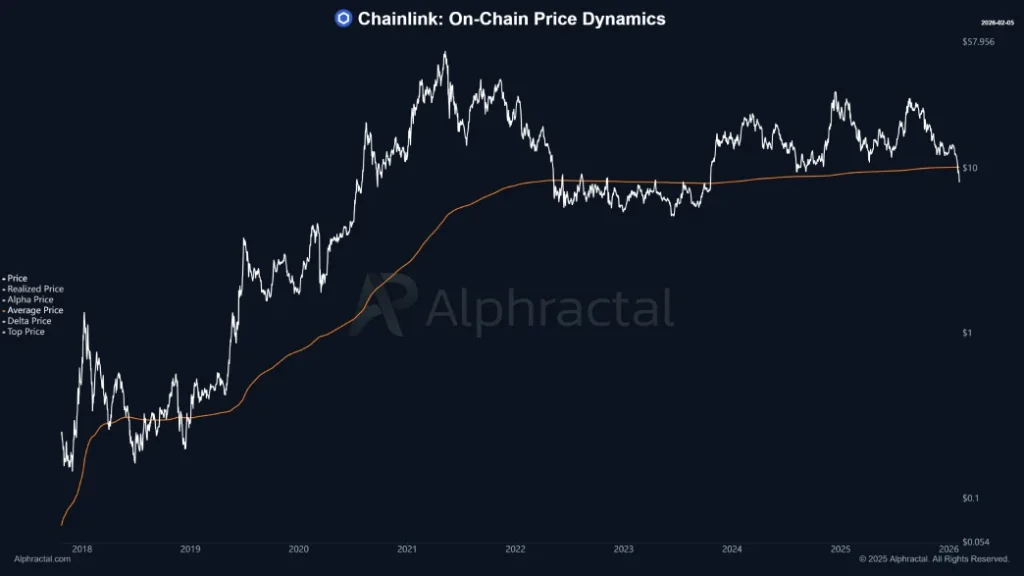
Recent on-chain readings for Chainlink show that one of the key structural levels in internal capital flow metrics has broken down. Network-based capital rotation has been trending outwards for a long time so the implication is that the participants are reallocating rather than compounding in the ecosystem.
This shift seems to be visible with realized-cap momentum, NUPL positioning and smoothed on-chain price bands which have flattened since 2022. Historical parallels illustrate that when these measures weaken simultaneously, Chainlink price shifts its trajectory sideways to recouped bullish momentum rather than instant recovery.
Sporadic rallies may interspersed this time, fueled by cycles of liquidity or broader market movements, but they have often dissipated without renewed inflows of networks. The dominant pattern is representative of a slow recalibration phase that might extend out months or years.
Despite the risk of a prolonged sideways to bearish trend, Chainlink reserve continued to bag more $LINK tokens. Earlier today, the strategic token reserve accumulated over the 125,454.48 $LINK on Thursday, bringing its total holdings to 1.9 million $LINK.
According to the official dashboard this takes the total to 1899,670.39 $LINK, purchased at an average price of $15.73 per token. The current estimated worth of these holdings is somewhere in the $15.2 – $16.3 million USD range depending on the fluctuations of the market at the time of estimation.
The mechanism pulls tokens from two primary sources: payments made offchain by major institutional users integrating Chainlink’s oracle services, and fees collected directly onchain by decentralized applications leveraging its data feeds, automation and cross-chain capabilities.
Chainlink Price Poised For Relief Rally Before Next Downswing
With an intraday loss of over 14%, the Chainlink price gave a decisive breakdown below the support trendline of a long-coming falling wedge pattern. Since August 2025, the two converging trendlines of the wedge acted as dynamic resistance and support to $LINK traders, driving a steady correction to price.
The recent breakdown below the bottom support indicates aggressive nature of sellers to drive a prolonged correction. However, the post-breakdown fall could show a temporary relief rally to $9 and retest the breached trendline as potential support.
The momentum indicator RSI at 22% highlights an oversold outlook, bolstering the potential for a bullish rebound in price.
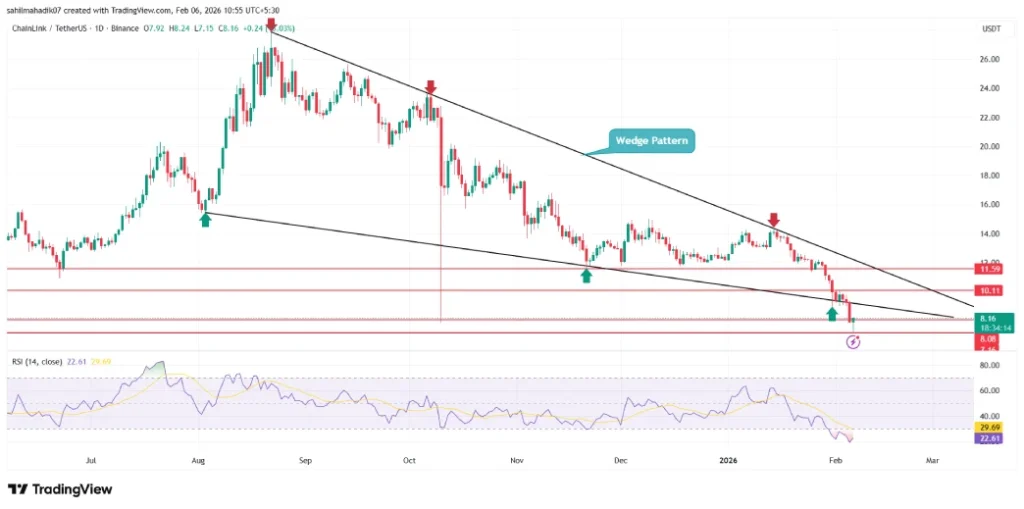
$LINK/USDT -1d Chart
If sustained, the sellers could force an extended correction below $7 support, followed by a dip to $5.64.

 cryptonewsz.com