
Table of Contents
Dogecoin is holding the $0.10 support for now, but the risk of a breakdown remains real. Based on current price structure, momentum indicators, and on-chain data, $DOGE is not showing the strength needed for a clean rebound. Unless buying pressure improves, a move below $0.10 cannot be ruled out.
Dogecoin Price Holds $0.10 But Momentum Remains Weak
Dogecoin, the largest memecoin by market capitalization, is still stuck in a corrective structure. Over the past week, $DOGE has dropped more than 16%, even as renewed attention from Elon Musk briefly lifted sentiment.
At the time of writing, $DOGE trades just above $0.10. This level has acted as a psychological and technical support in past market cycles. The issue is not the support itself. The issue is the lack of follow-through buying above it.
Short-term momentum indicators confirm this hesitation. On the 4-hour chart, the Money Flow Index sits at 54.4. This is slightly above neutral and points to modest capital inflows, not strong accumulation. In prior rallies driven by hype, MFI readings pushed closer to 70. That is not happening now.
Why Elon Musk’s Comments Failed To Lift Price
Sentiment-driven catalysts have lost their punch across crypto markets, and Dogecoin is a clear example.
On Feb. 2, the Tesla Owners Silicon Valley account asked Elon Musk about his 2021 claim that SpaceX would put Dogecoin on the moon. Musk replied that it could happen next year. In the 2021 bull cycle, a response like this alone could have pushed $DOGE up by double digits.
This time, price barely reacted.
That tells an important story. Market participants are no longer chasing headlines without confirmation from price and volume. Hype alone is failing to override the prevailing trend, which remains corrective.
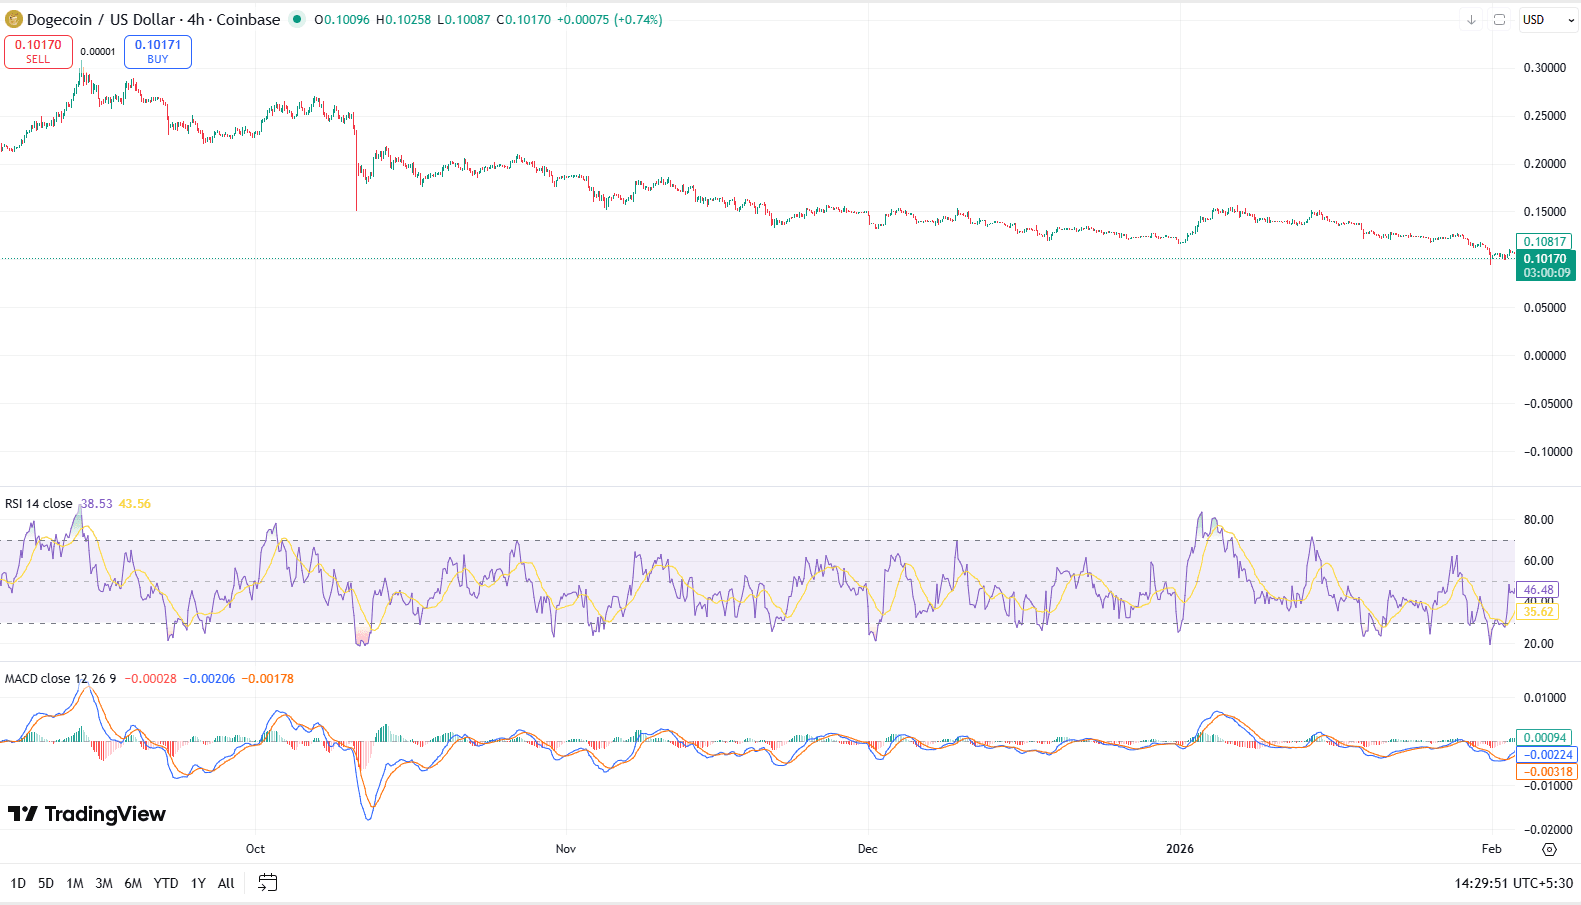
What The Chart Says About Dogecoin’s Trend
On the 4-hour chart, $DOGE remains capped below a descending resistance band near $0.12. This zone acted as support before the January breakdown. Repeated failures to reclaim it suggest strong overhead supply.
As long as price stays below this area, $DOGE is likely to remain range-bound.
The attached chart reinforces this view. RSI has hovered in the lower half of its range, struggling to stay above 50. MACD remains close to the zero line, with shallow histogram bars. These signals point to balance, not strength.
What Does Rising Network Activity Mean?
An important counterpoint comes from on-chain data.
Dogecoin network activity jumped sharply over the past week. Active addresses rose by 36%, climbing above 71,400, according to Santiment data shared by Ali Charts on Feb. 3. This marks the strongest weekly increase shown on the snapshot.
Dogecoin $DOGE network activity jumped 36% over the past week, with active addresses rising above 71,400. pic.twitter.com/LCBMMez4O7
— Ali Charts (@alicharts) February 3, 2026
Key details from the data include:
- Active addresses rose steadily, not in a single spike
- Activity moved from the low 50,000s to over 71,400 by Feb. 1
- Growth coincided with renewed market attention on $DOGE
Rising activity signals heavier on-chain usage, which is often constructive. However, network growth alone does not guarantee price appreciation. Without sustained demand in spot markets, price can still drift lower.
Is Dogecoin Returning To A Long-Term Base?
According to a TradingView, Dogecoin has returned to a long-term base zone near $0.10. This area previously acted as a consolidation range before earlier expansions.
$DOGE rallied strongly during August and September before entering distribution in October. A sharp reversal followed, triggering a deep liquidity sweep into November. Since then, price has moved sideways through December and January.
This structure suggests sellers may be exhausted. Volatility has compressed, and downside momentum has slowed. That supports the idea of stabilization, but not yet a confirmed recovery.
Where Are Key Support And Resistance Levels?
Several levels now define Dogecoin’s near-term outlook.
Immediate support:
- $0.10 as the major historical base
Immediate resistance:
- $0.135 to $0.150, former support turned resistance
Higher resistance zones:
- $0.188
- $0.215
- $0.255
- $0.284
For $DOGE to avoid a drop below $0.10, buyers must defend the current base and reclaim $0.12 with volume. Without that, support remains fragile.
Conclusion
Dogecoin is holding $0.10 support, but it is doing so without strong momentum. Technical indicators show stabilization, not recovery. Network activity is rising, which helps the long-term case, but price action has yet to confirm it.
If buying pressure improves and $DOGE reclaims key resistance, the $0.10 level could mark a durable base. If not, a temporary move below support remains a realistic risk.
Resources
-
Dogecoin on TradingView: $DOGE price action
-
Ali Charts on X: Recent post on $DOGE network activity