Shiba Inu tests critical lower Bollinger Band support as liquidations rise, with bearish momentum continuing and resistance near the upper band.
The Shiba Inu ($SHIB) market has been facing increased pressure, registering a 4.3% loss in the past 24 hours. The price has been fluctuating within a range between $0.00000647 and $0.00000681, but the recent trend shows a clear decline, with $SHIB close to $0.0000065.
Despite the drop, the memecoin maintains a market cap of $3.81 billion and a solid 24-hour trading volume of $188.28 million. However, over the past 14 days, Shiba Inu has witnessed an 18.8% decline, signaling consistent weakness in its price action.
This downturn also shows in the overall Shiba Inu performance, which has seen a significant drop of 30.4% over the past 30 days. As Shiba Inu sits around its lower support levels, the market will need to closely monitor for any signs of stabilization or possible recovery. Where Next?
What’s Next for Shiba Inu
Shiba Inu is currently testing its lower Bollinger Band, which sits at approximately $0.000006301. This level has recently prevented downward moves, hence a critical support zone. If $SHIB fails to maintain its position above this level, there is a risk of further downside, with the next key support target potentially around $0.0000058 or even lower.
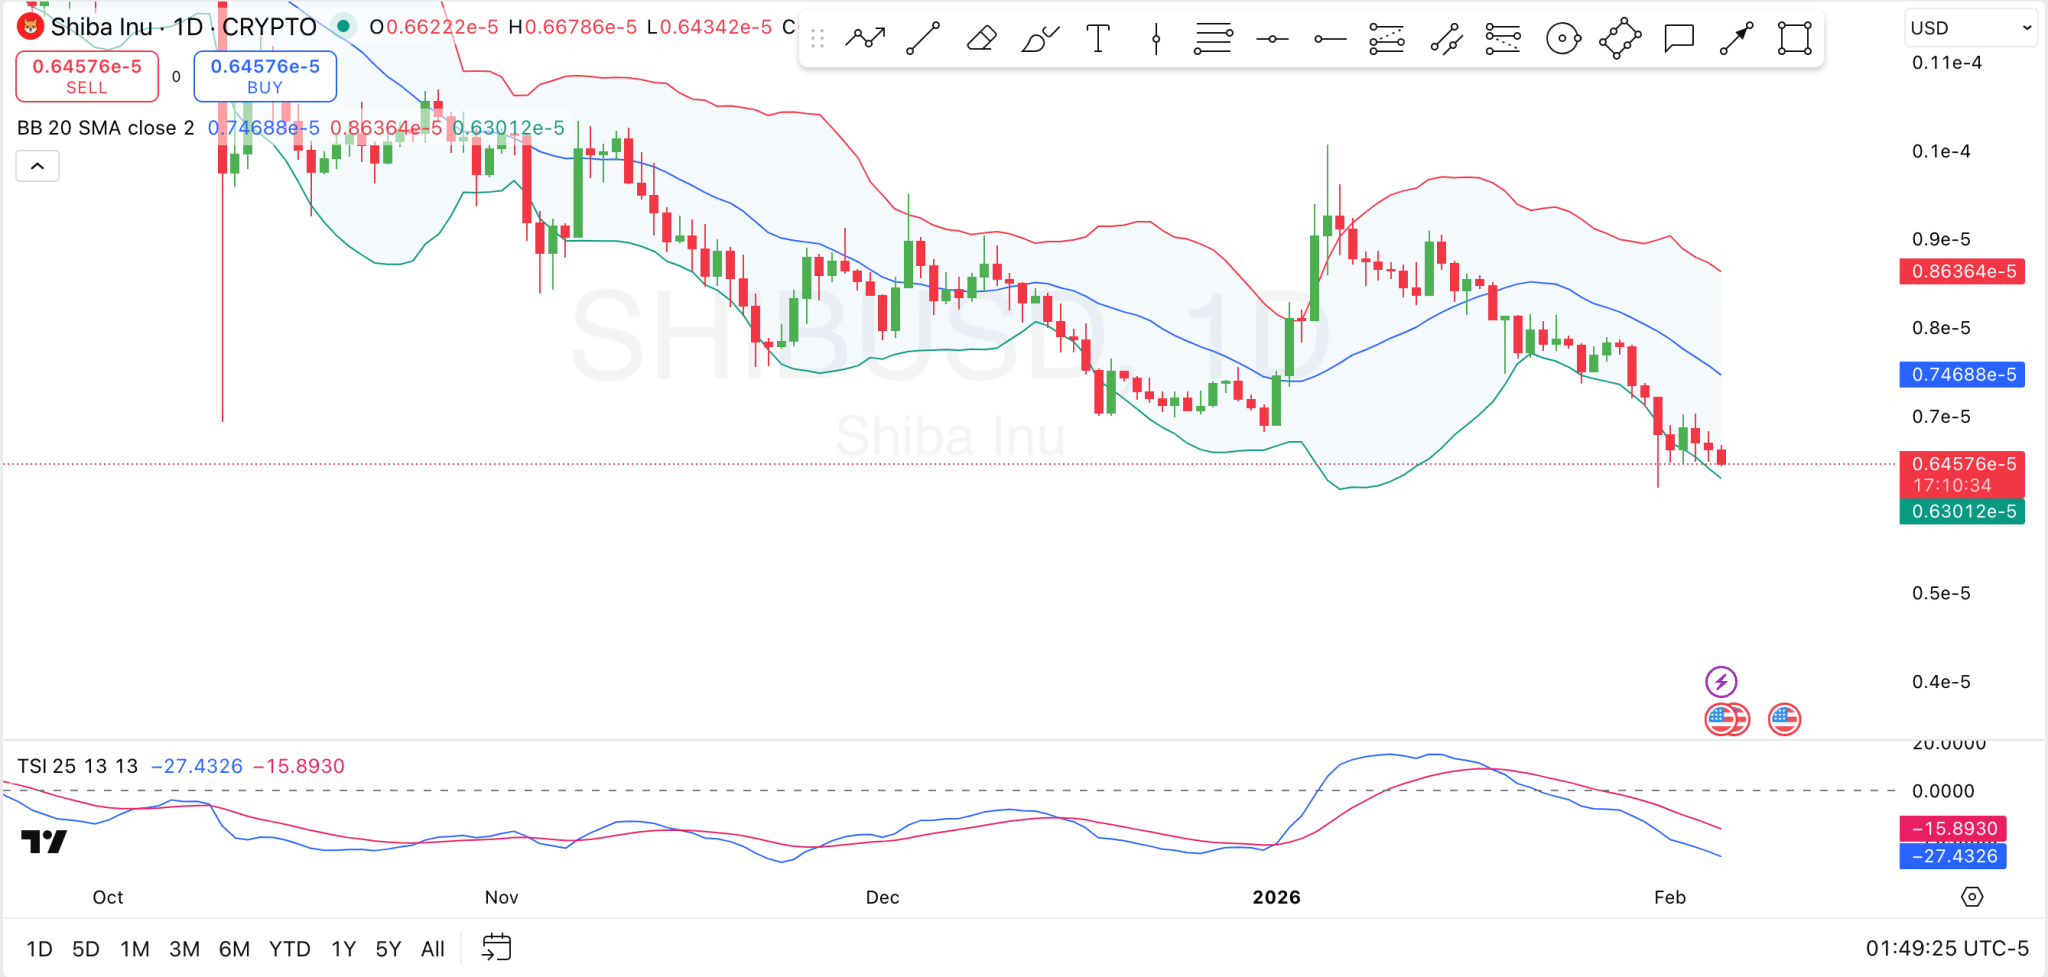
On the resistance side, $SHIB is facing significant pressure around the upper Bollinger Band, which sits at $0.000008636. This level has previously capped price movements and is considered a strong barrier to further upward momentum. A breakout above this resistance would be a key signal for a possible trend reversal and a move toward more favorable price levels, such as the $0.00001 mark, where further liquidity exists.
The True Strength Index indicator currently shows a persistent bearish trend, with the blue line sitting below the red line, signaling sustained selling pressure. The TSI is currently at -27.43, indicating a drop in positive momentum. Notably, a flip of the blue line above the red line would be necessary to signal a potential recovery.
Shiba Inu Liquidation Data
Over the past 24 hours, Shiba Inu saw $135.97K in total liquidations, with $120.24K from long positions and $15.74K from short positions. In the last 12 hours, $55.84K was liquidated, with $45.79K from long positions and $10.05K from short positions.
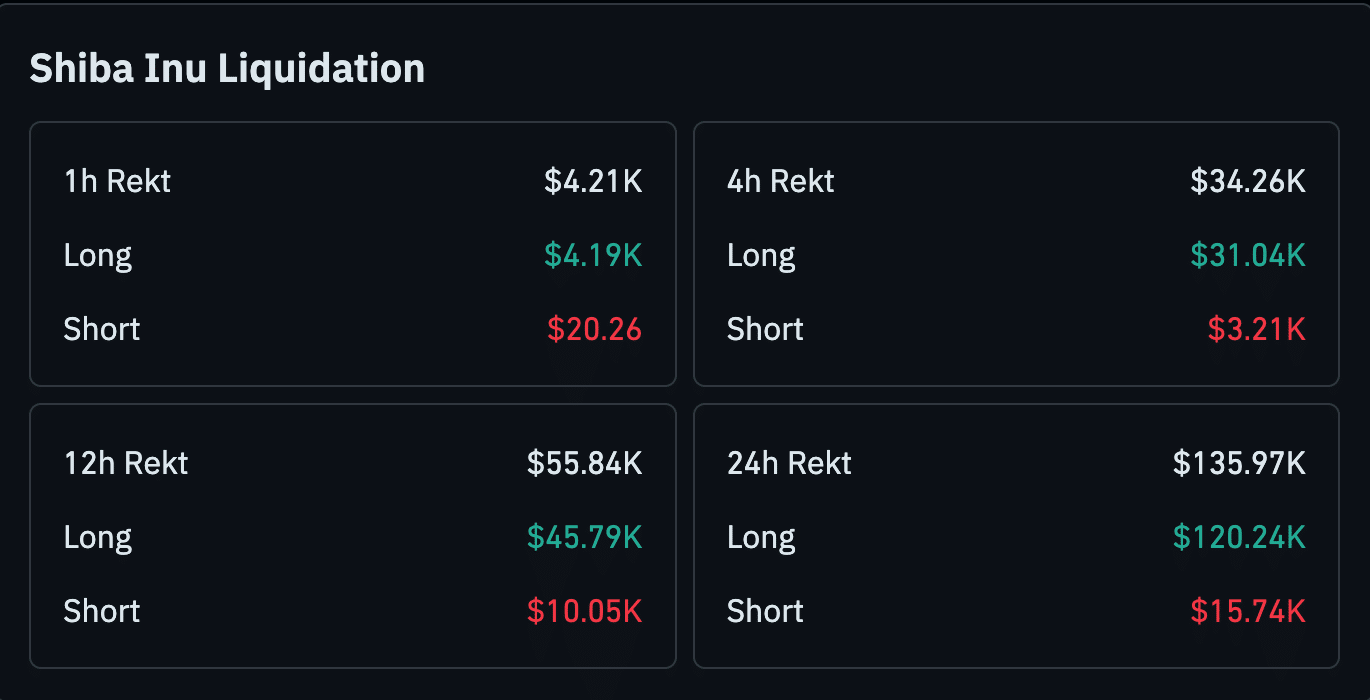
Within the last 4 hours, Shiba Inu experienced $34.26K in liquidations, with $31.04K from long positions and $3.21K from shorts. The 1-hour data shows $4.21K in liquidations, with $4.19K from long positions and $20.26 from short positions.
The numbers suggest that there is strong participation in long positions, with a relatively low number of short liquidations compared to long ones.