
 cryptoticker.io

Solana Price Analysis: The Anatomy of a Crash
The current price action os $Solana reveals a stark technical shift: what was once a rock-solid floor has now become a formidable ceiling.
- The Breakdown: After failing to sustain momentum near the $118–$120 supply zone in late January, $SOL entered a freefall. The 2-hour chart shows the price currently fighting to stabilize near $95.72 after dipping as low as $93.38.
- Negative Funding Trap: Market sentiment is currently at an extreme. Data shows the OI-weighted funding rate has turned negative (roughly -0.0057%), meaning short-sellers are so aggressive they are actually paying long-holders to keep their bearish bets open.
- Oversold Signals: On the 2-hour timeframe, the Stochastic RSI is buried at 6.38, deep in oversold territory. While this suggests the selling pressure is reaching a point of exhaustion, any relief bounce will face immediate and heavy resistance at the $100.30 and $106.53 levels.
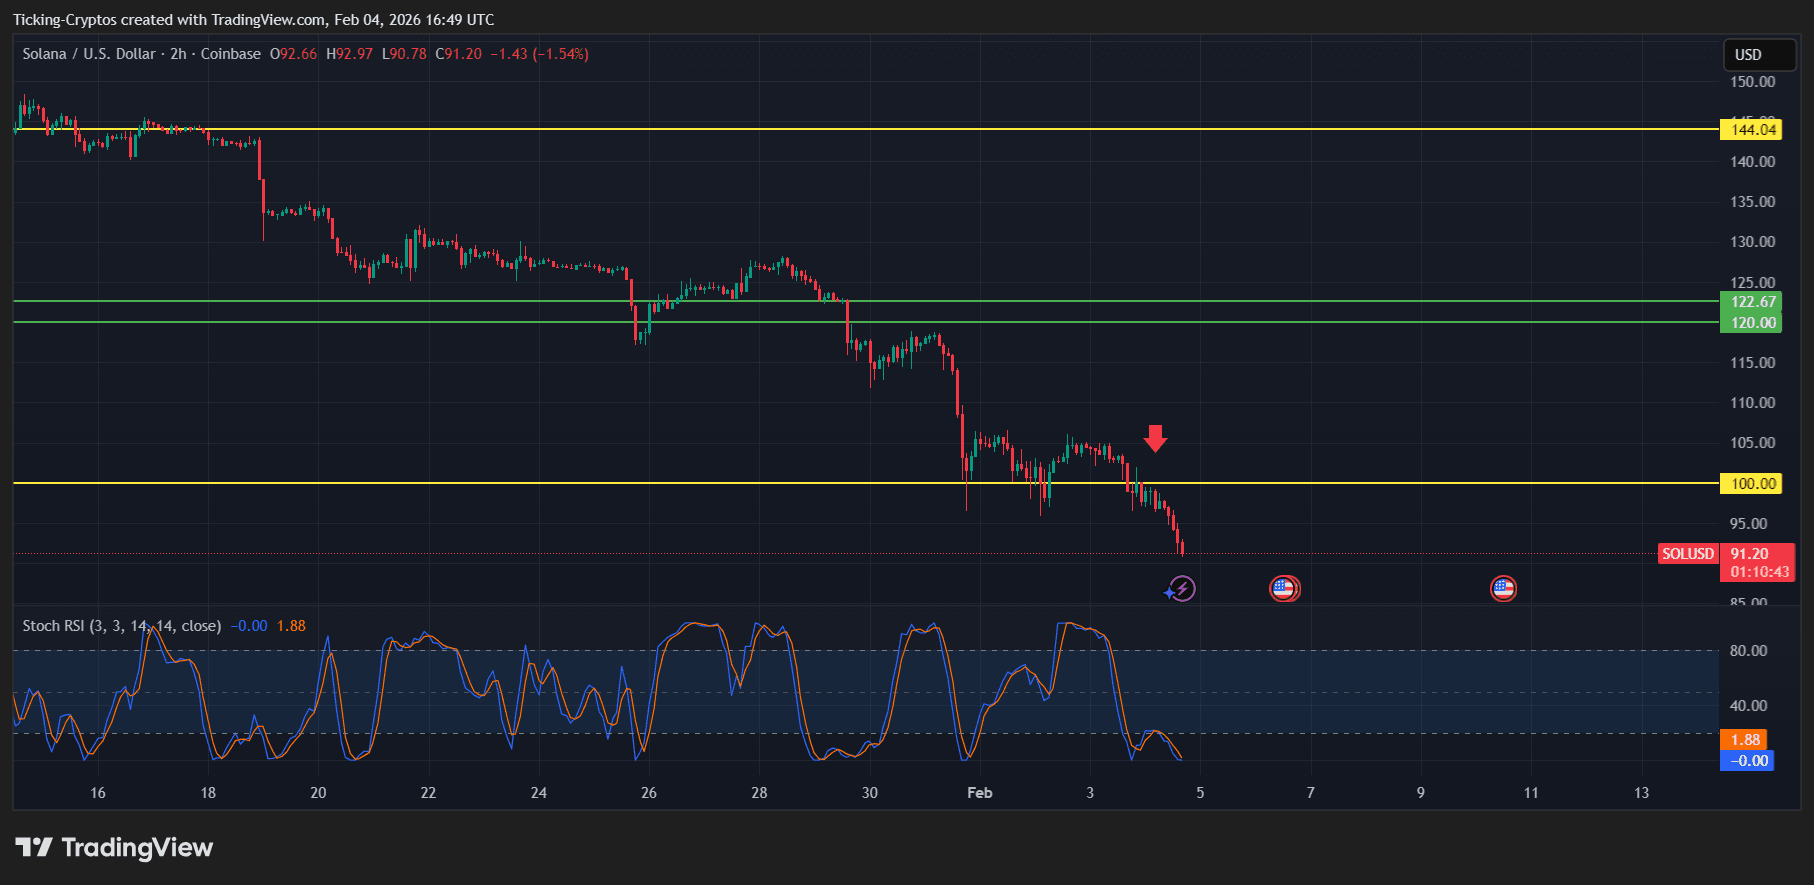
$SOL/USD 2H - TradingView



