
The Solana price remains under heavy pressure in early February, with the token down nearly 30% over the past 30 days and trading inside a weakening descending channel. Price continues to grind toward the lower boundary of this structure as long-term conviction fades.
At the same time, net staking activity has collapsed, exchange buying has slowed, and short-term traders are building positions again. Together, these signals suggest that more $SOL is becoming available for potential selling just as technical support weakens.
Staking Collapse Meets Descending Channel Breakdown Risk
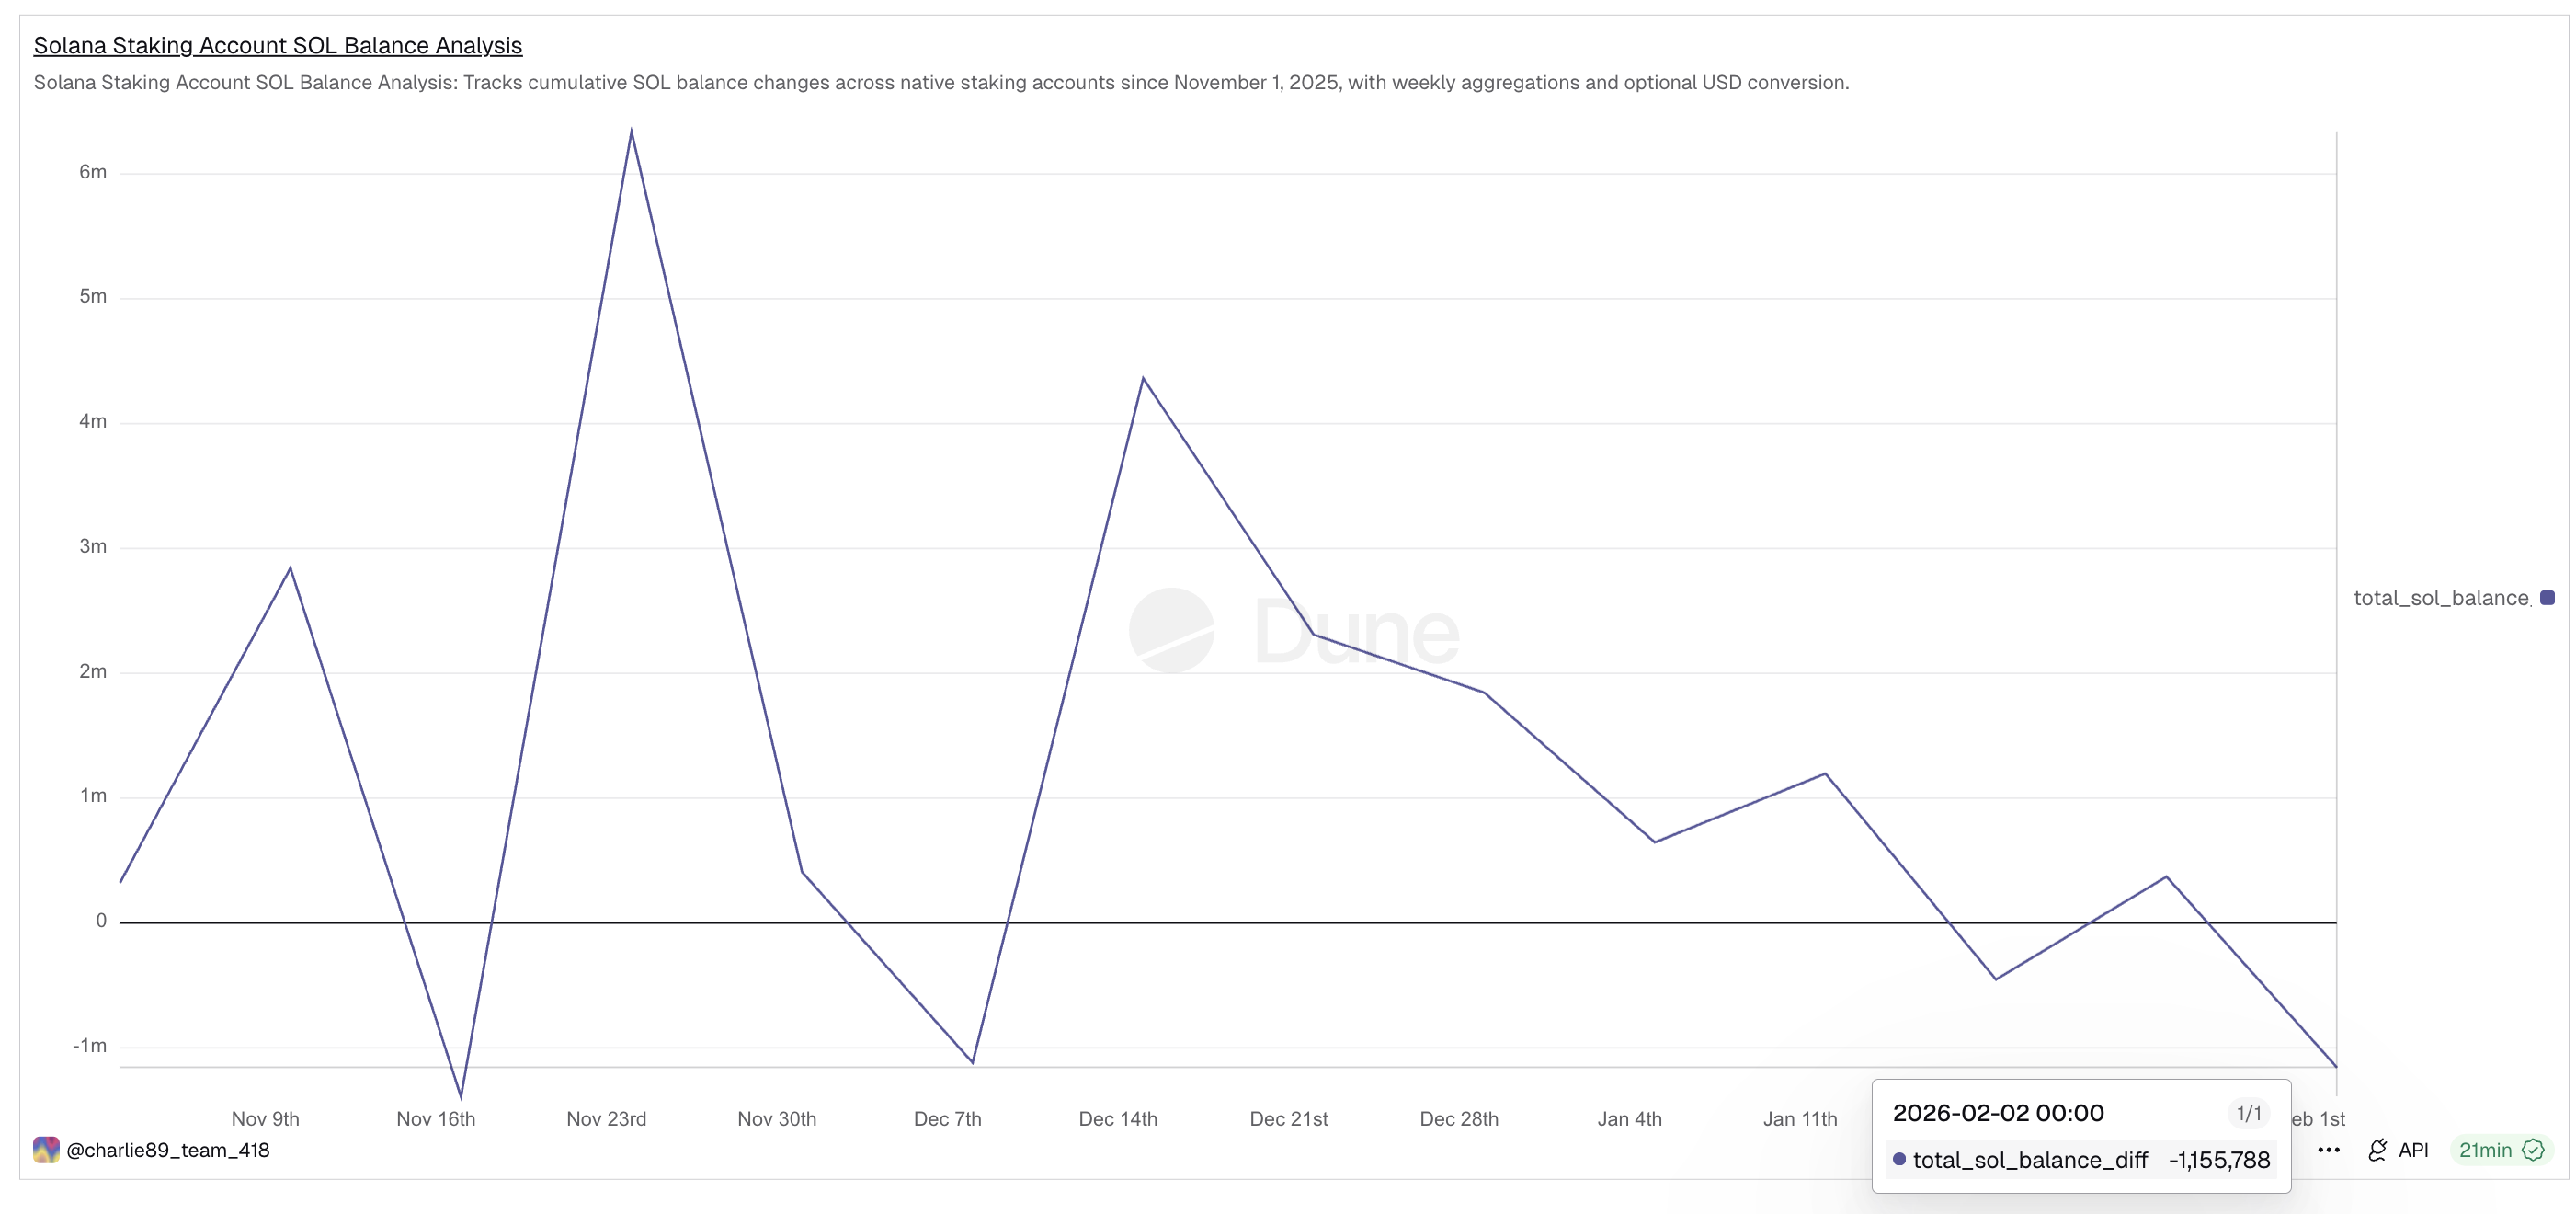
Solana’s latest weakness is being reinforced by a sharp drop in staking activity. The Solana staking difference metric tracks the weekly net change in $SOL locked in native staking accounts. Positive values show new staking, while negative readings indicate net unstaking.
In late November, long-term conviction was strong. During the week ending November 24, staking accounts recorded net inflows of over 6.34 million $SOL, marking a major accumulation phase.
That trend has now fully reversed. By mid-January, weekly staking flows had turned negative. The week ending January 19 showed net unstaking of around –449,819 $SOL. By February 2, this had worsened to –1,155,788 $SOL, a surge of roughly 150% in unstaking within two weeks.
Want more token insights like this? Sign up for Editor Harsh Notariya’s Daily Crypto Newsletter here.
This means a growing amount of $SOL is being unlocked from staking and returned to liquid circulation. Once unstaked, these tokens can be moved to exchanges and sold immediately, increasing downside risk.
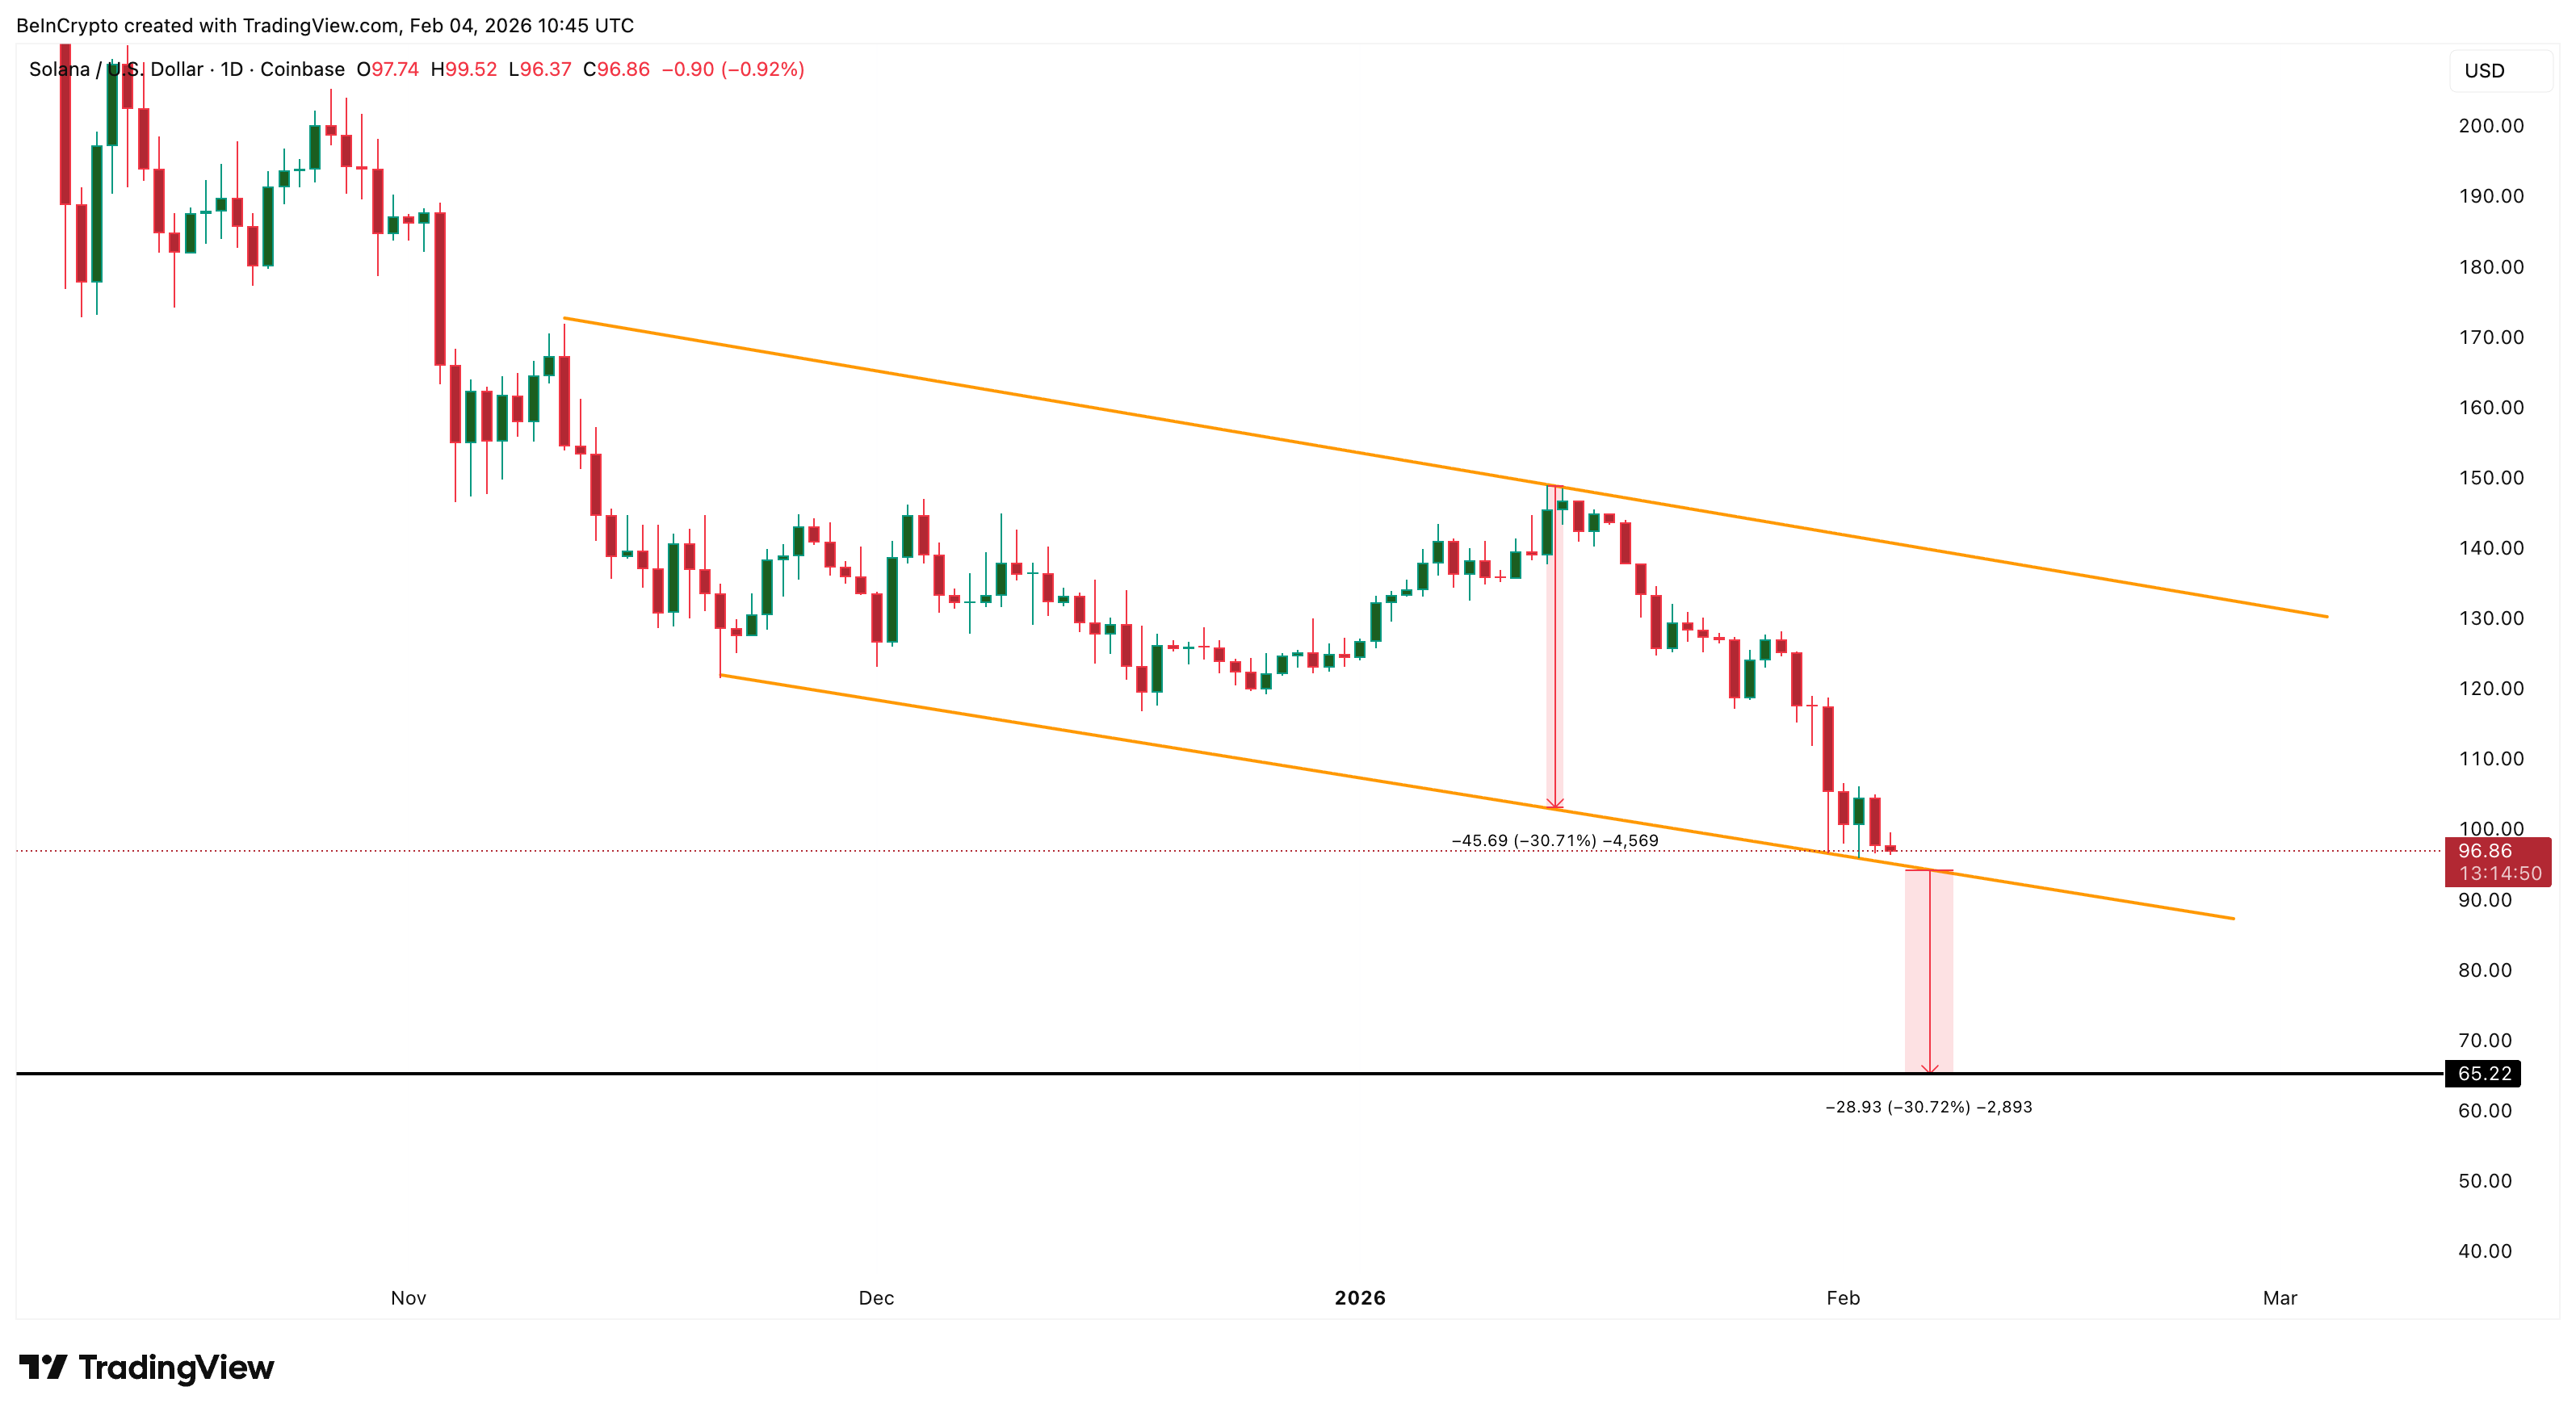
This collapse is happening as price trades near the lower edge of its descending channel with a 30% breakdown possibility in play.
 $SOL Price Structure">
With $SOL hovering near $96, the combination of technical weakness and rising liquid supply creates a dangerous setup. If selling accelerates, the channel support may not hold.
Exchange Buying Slows as Speculators Increase Exposure
Falling staking activity is now being reflected in exchange flows. Exchange Net Position Change tracks how much $SOL moves onto or off exchanges over a rolling 30-day period. Negative values indicate net outflows and accumulation, while rising readings signal slowing demand.
On February 1, this metric stood near –2.25 million $SOL, showing strong buying pressure. By February 3, it had weakened to around –1.66 million $SOL. In just two days, exchange outflows dropped by nearly 26%, signaling that accumulation has slowed.
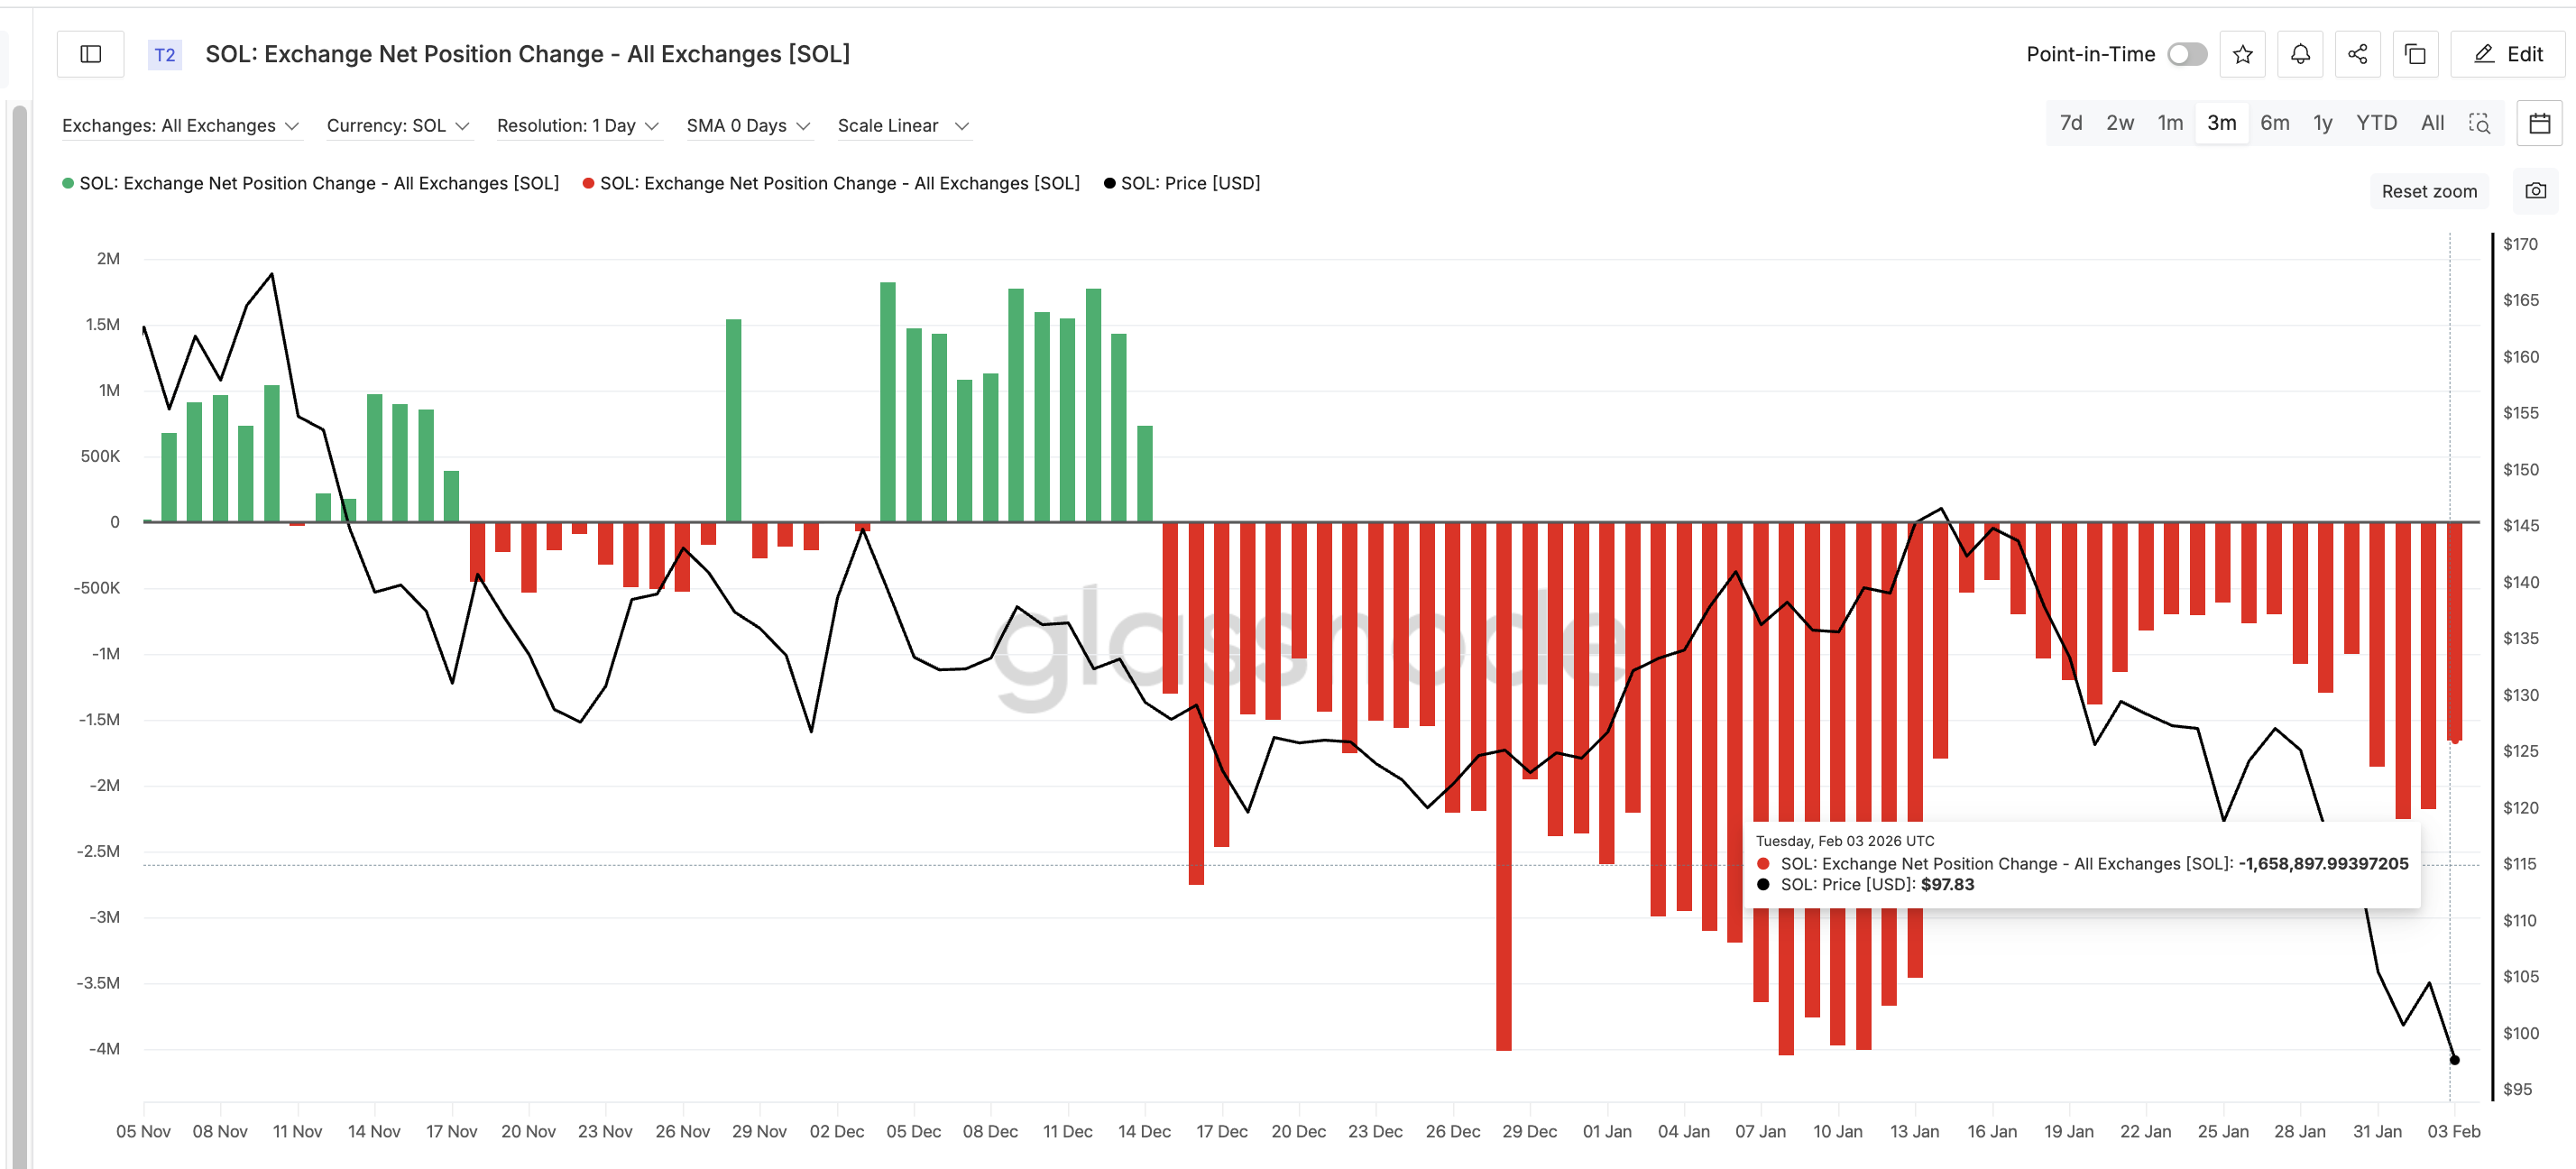
This decline in buying is occurring as unstaking accelerates, increasing the amount of $SOL available for trading. When supply rises while demand weakens, the price becomes more vulnerable to sharp declines.
At the same time, speculative activity is rising.
HODL Waves data, which separates wallets based on holding time, shows that the one-day to one-week cohort increased its share from 3.51% to 5.06% between February 2 and February 3. This group represents short-term Solana holders who typically enter during volatility and exit quickly.
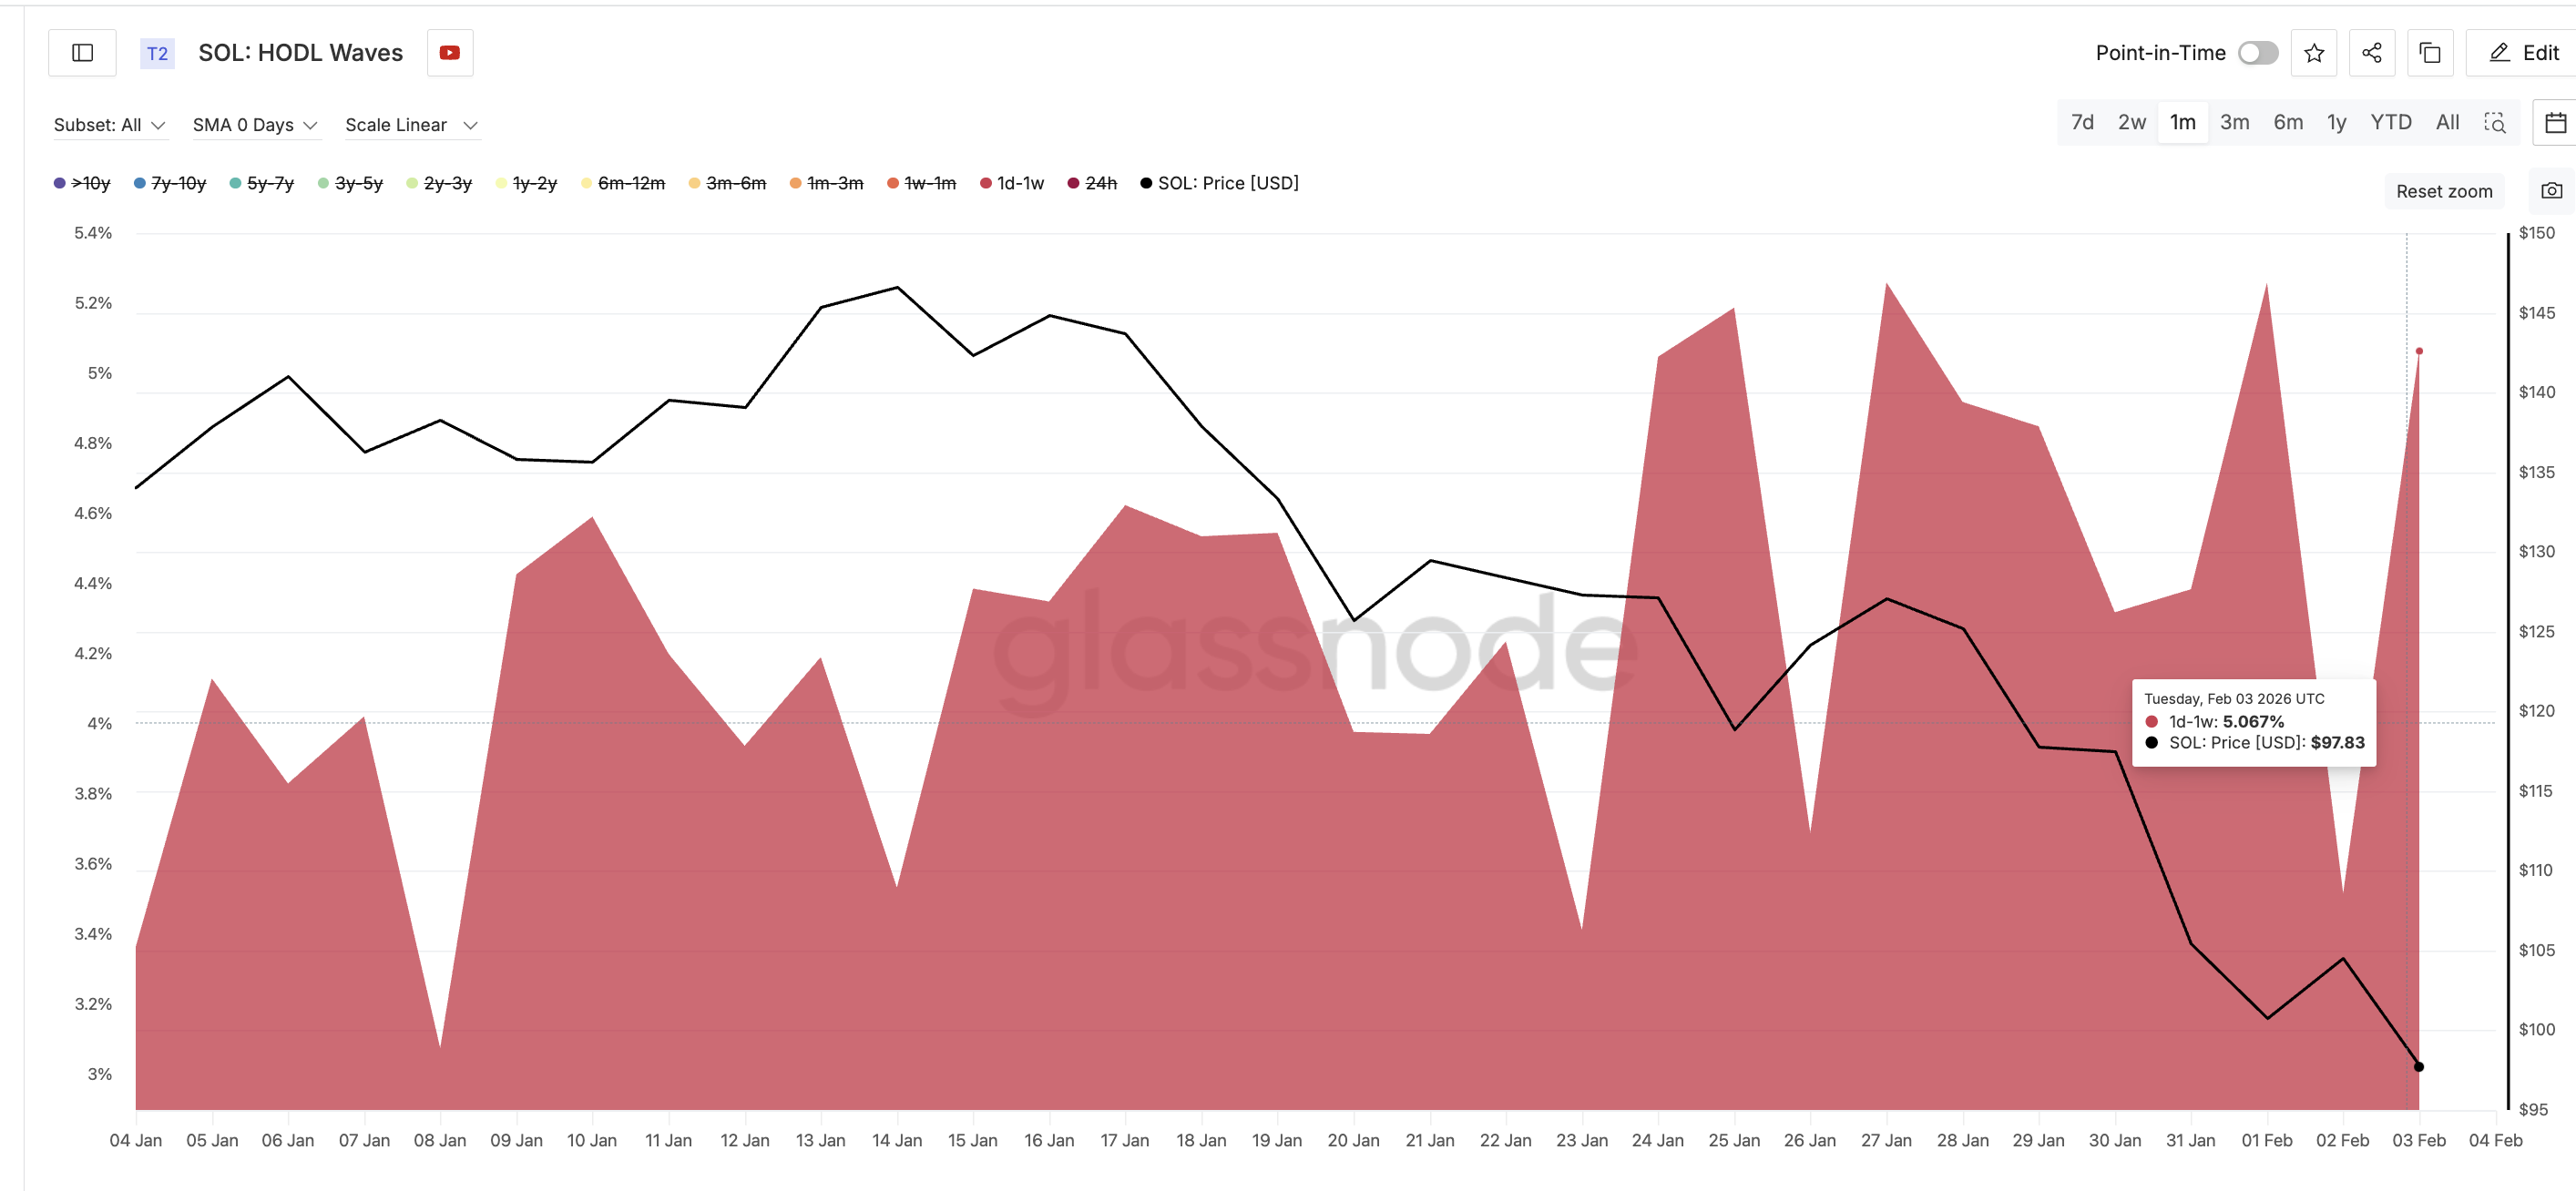
Similar behavior appeared in late January. On January 27, this cohort held 5.26% of the supply when $SOL traded near $127. By January 30, their share dropped to 4.31% as the price fell to $117, a decline of nearly 8%.
This pattern suggests that speculative money is positioning for short-term bounces rather than long-term holding, increasing the risk that bounces will fade.
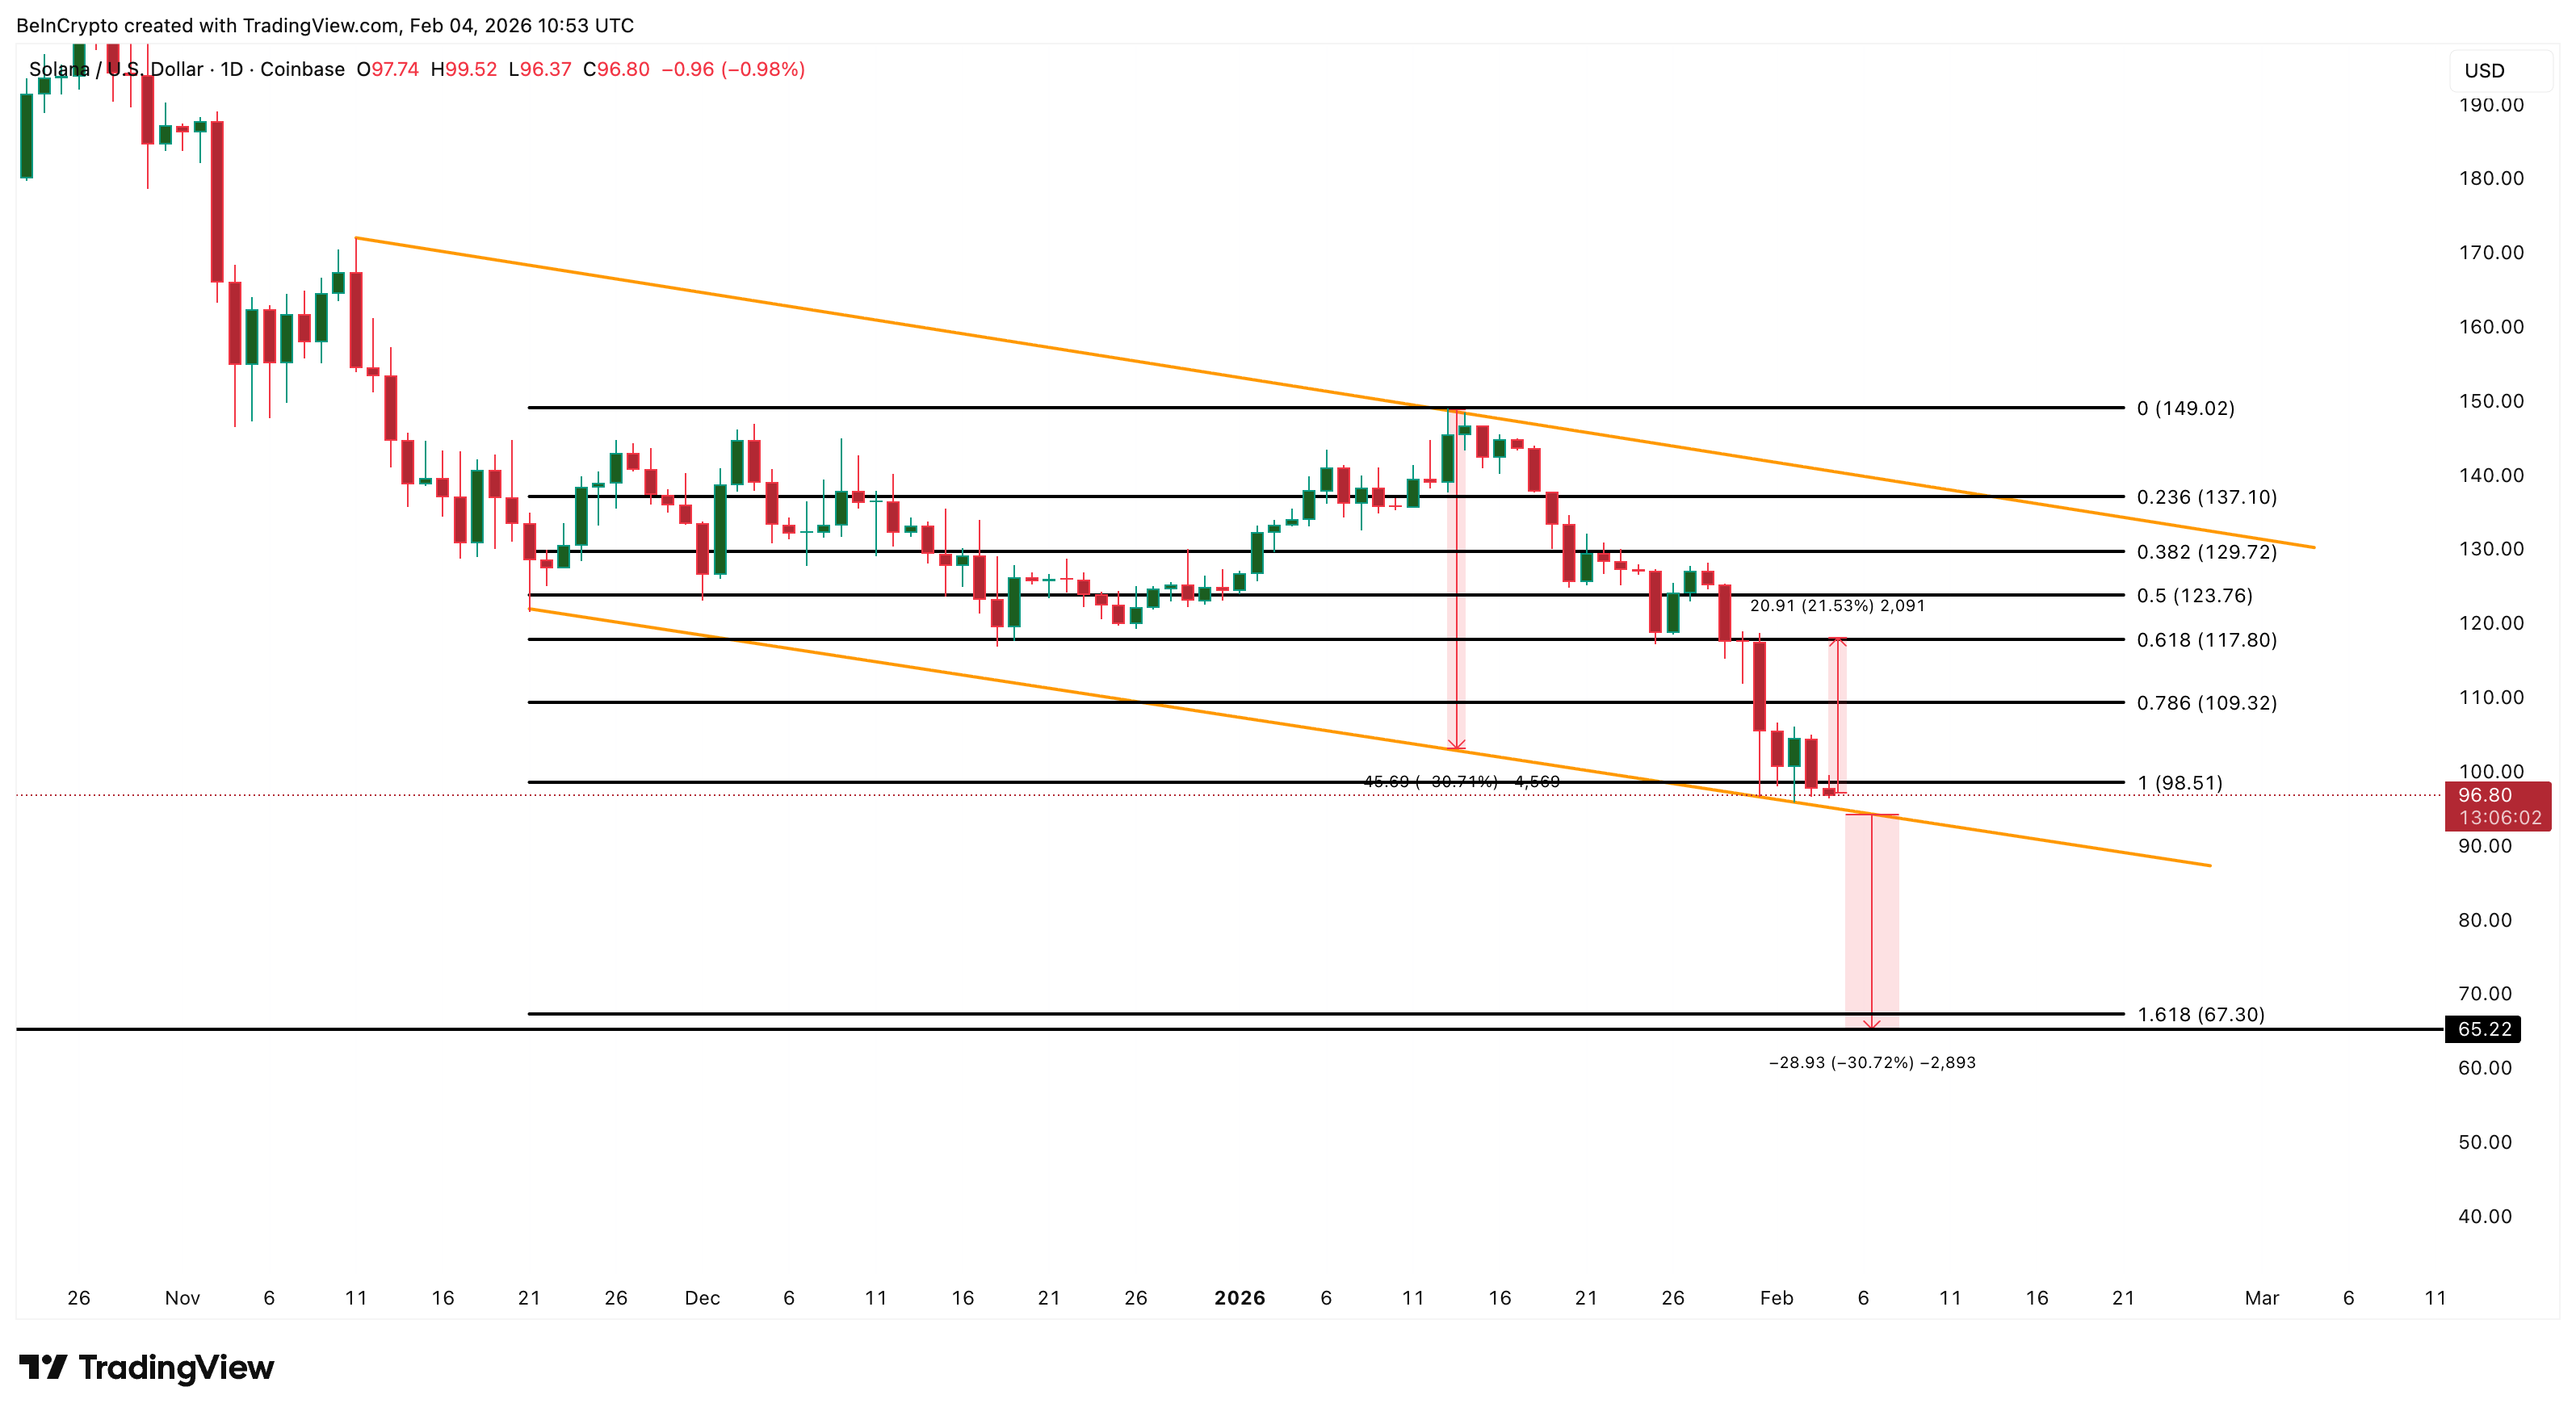
Key Solana Price Levels Still Point to $65 Risk
Technical structure continues to mirror the weakness seen in on-chain data. $SOL remains locked inside a descending channel that has guided price lower since November. After losing the critical $98 support zone, the price is now trading near $96, close to the channel’s lower boundary.
If this support fails, the next major downside target lies near $67, based on Fibonacci projections. A deeper move could extend toward $65, aligning with the full measured 30% breakdown of the channel.
On the upside, recovery remains difficult. The first level that Solana must reclaim is $98, followed by stronger resistance near $117, which capped multiple rallies in January. A sustained move above $117 would be required to neutralize the bearish structure.
Until then, downside risks remain elevated.
With staking collapsing, exchange buying weakening, and speculative positioning rising, more $SOL is entering circulation just as technical support weakens. Unless long-term accumulation returns, Solana remains vulnerable to a deeper correction toward $65.
The post Solana ($SOL) Unstaking Surges 150% — Rising Liquid Supply Opens Price Path to $65? appeared first on BeInCrypto.