Data confirms $XRP currently trades within the C wave of an ABC structure, and the nature of the flat would determine if it has bottomed or not.
$XRP has remained in a downward trend that recently dragged the token to a low of $1.52 before buyers pushed the price back up to around $1.60. As the market attempts to stabilize, data now suggests $XRP may be moving within an ABC corrective structure under Elliott Wave Theory.
$XRP likely formed Wave A at $1.61 in April 2025 and Wave B at $3.65 in July 2025, placing the market in Wave C today. Depending on whether the correction develops as a running flat, regular flat, or expanded flat, $XRP could stabilize near current levels or slide significantly lower.
Key Points
- $XRP recently fell to $1.52 before rebounding to around $1.60 as market data suggests it may be trading within an ABC structure.
- The ABC structure places Wave A at $1.61 in April 2025 and Wave B at $3.65 in July 2025 on the weekly chart.
- $XRP currently trades in Wave C, and the bottom of this wave would depend on the nature of the ABC structure.
- A running flat suggests $XRP could hold above roughly $1.61, with support near $1.70 to $1.62.
- A regular flat points to a dip toward about $1.55 to $1.51.
- An expanded flat opens downside risk toward roughly $1.06 or even near $0.34.
$XRP ABC Structure Indecisive
Market analyst Charting Guy introduced this concept in a recent commentary, noting that the current price action aligns with several possible flat formations that could determine $XRP’s next move.
The analyst explained that traders’ outlook depends on whether the market already formed a bottom, is approaching one, or still needs another major drop. He highlighted three possible flat scenarios: running flat, regular flat, and expanded flat. Notably, each of these produces different outcomes.
To him, the expanded flat setup appears most reasonable because Wave B moved beyond the starting point of Wave A while only printing slightly higher highs rather than surging sharply or forming a double top.
$XRP Weekly Chart Levels
If $XRP truly follows this ABC structure, the formation likely developed on the weekly timeframe. In this chart, $XRP reached its Wave A bottom when the price dropped to $1.61 in April 2025. The market then staged a strong rally that sent $XRP to a Wave B peak of $3.65 in July 2025.
With $XRP now trading close to $1.60, the asset appears to be moving through Wave C. According to the commentary from Charting Guy, the type of flat correction now in play will determine whether $XRP already touched its low or still faces sharper declines ahead.
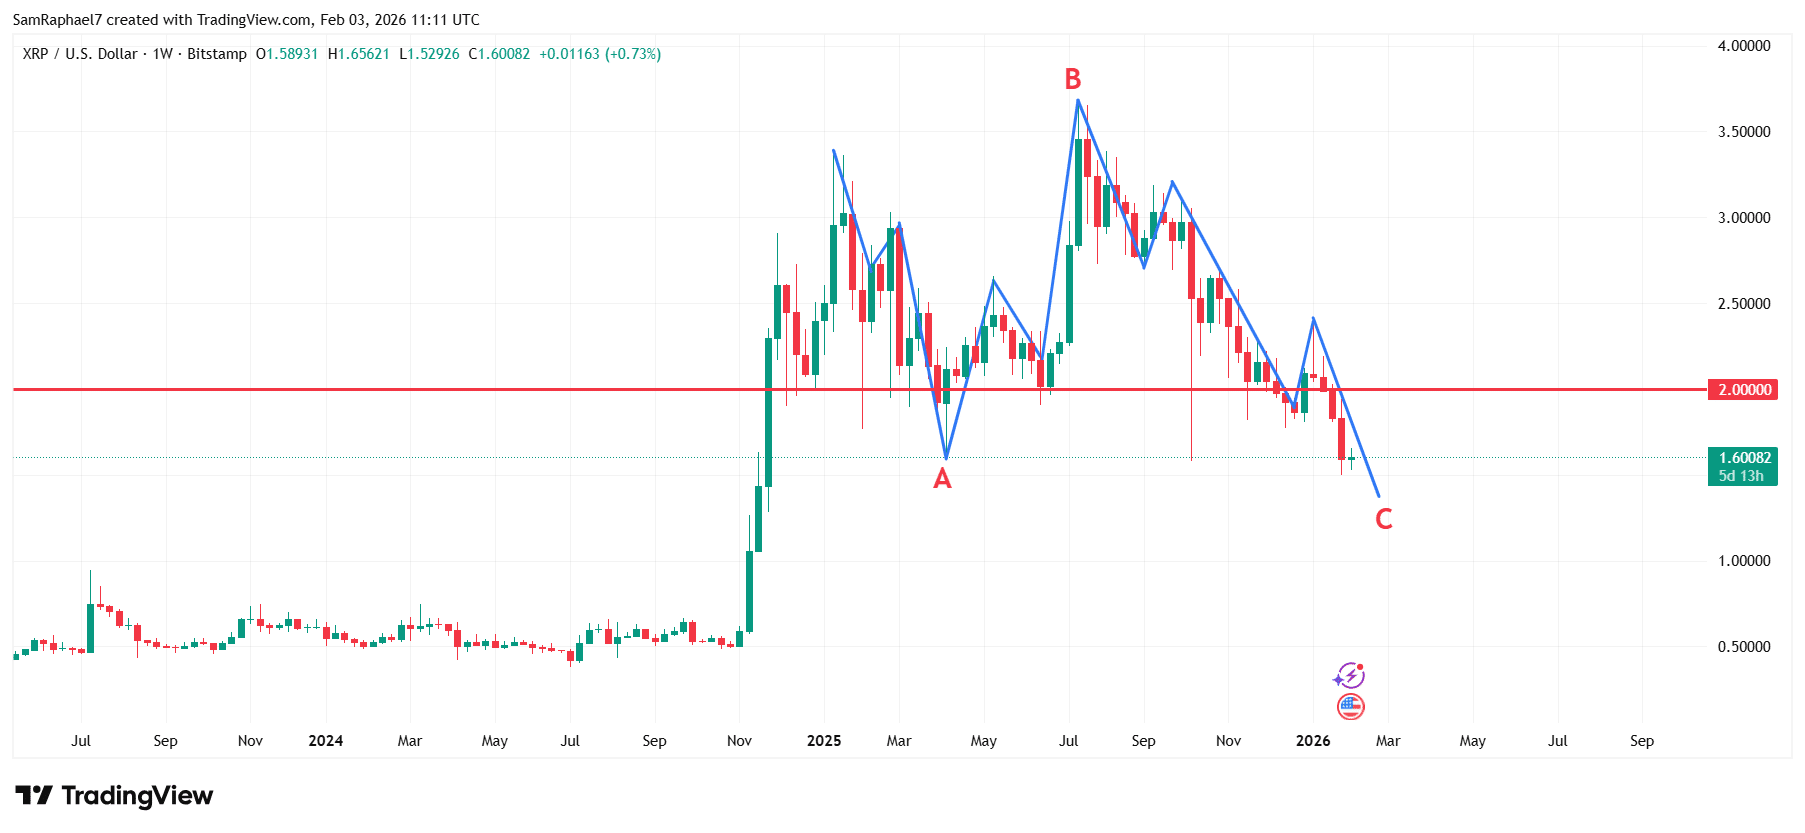
In all flat corrective patterns, Wave C typically begins at the end of Wave B, around $3.66, and extends downward. The depth of that move changes depending on whether the structure forms as a running flat, regular flat, or expanded flat.
Running Flat Scenario Suggests Limited Downside
In a running flat pattern, Wave B moves beyond the start of Wave A while Wave C fails to drop below the Wave A low. With this scenario, $XRP would not break beneath the $1.61 level.
The guide places Wave C at roughly the same length as Wave A, which mathematically points again to around $1.61. However, in true running flats, prices usually hold above that area, creating a likely support range between approximately $1.70 and $1.62. This outcome would imply $XRP may already sit near its bottom.
Regular Flat Points to a Slight Break Below Support
Meanwhile, in a regular flat structure, Wave B typically retraces nearly all of Wave A’s decline, while Wave C often extends slightly past the Wave A bottom. Analysts typically project Wave C at 100% to 105% of Wave A’s size.
With these levels, a full 100% move would again target roughly $1.61, while a 105% extension would pull $XRP down to about $1.51. This places the expected regular flat support zone between roughly $1.55 and $1.61.
Expanded Flat Leads to Much Deeper Declines
However, in an expanded or extended flat pattern, Wave B pushes well beyond the start of Wave A, while Wave C commonly stretches far below the previous low using Fibonacci extensions.
When one applies a 1.27 extension of Wave A, the downside target appears at $1.06. A larger 1.618 extension would lead to a drop toward $0.34. In this situation, $XRP could fall anywhere from around $1.50 down to near $0.30, depending on how aggressively the correction unfolds.
Important Caveat
Running flats tend to appear less often on larger timeframes, which makes analysts cautious about assuming $XRP has already found its bottom. All of these projections remain valid only as long as the ABC structure holds. However, market changes can always invalidate wave counts.