However, that positive momentum did not last long. As market excitement cooled, many investors began booking profits, leading to a broader sell-off. $XRP was not spared from this shift and soon slipped back below the important $2 level.
Fast forward to today, $XRP is trading near $1.60 and showing early signs of stabilization after recently falling to a low of $1.53.
Important Resistance Levels to Watch for $XRP
As per Casitrade’s analysis, $XRP has completed a major downside move and is now sitting in what traders call the “golden pocket” support zone.
Looking at her $XRP price chart, the recent drop followed an Elliott Wave pattern, with Wave 3 ending near the $1.55 to $1.60 area. This level acted as solid support and helped stop the fall.
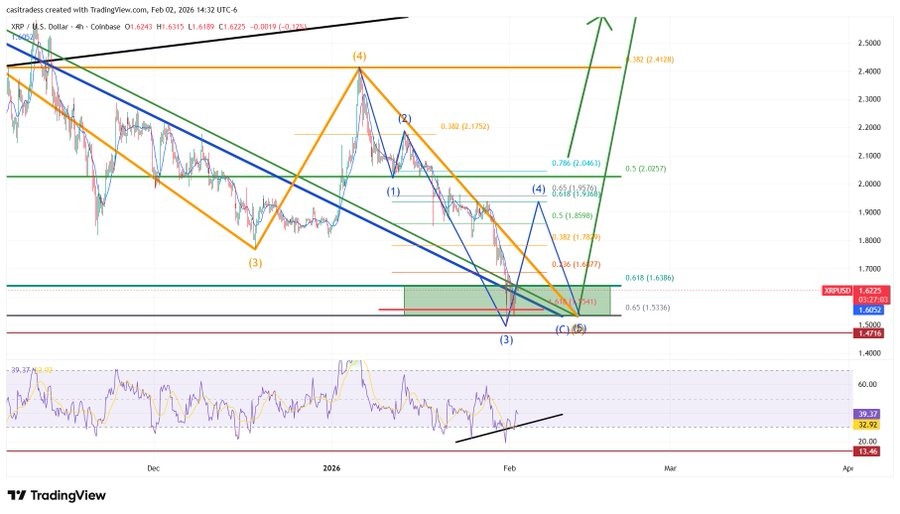
Now traders are watching for a possible Wave 4 relief rally. As the first key resistance level to watch is around $1.78, which matches the 0.382 Fibonacci retracement and could act as a barrier.
Further, CasiTrades explains that Wave 2, earlier in the cycle, was very shallow. In Elliott Wave theory, when Wave 2 is shallow, Wave 4 usually becomes deeper. That means $XRP could push higher than many expect during this relief rally.
If buyers step in with strength, $XRP could move toward $1.93 or even $2.03. The $2.03 level is especially important because it represents the macro 0.5 retracement zone.
Why $2.03 Is a Critical Level for $XRP
CasiTrades analysis highlights that $XRP must reclaim $2.03 and hold above it to change the current bearish structure. If the price successfully breaks and stays above this level, it would reduce the chances of another drop toward $1.55 or lower.
A strong move above $2.03 could also increase the possibility that the expected final bearish wave fails, opening the door for a larger recovery.

 coinpedia.org