The golden pocket support has cushioned recent $XRP bearish price action and could provide the momentum needed to spark a recovery.
$XRP fell nicely within this golden pocket, widely known as the 0.618 Fibonacci level. Here, it hit the 1.618 Fibonacci level, fell briefly below the 0.65 Fibonacci level, and then reclaimed the former support area.
This textbook move could mark the end of a corrective wave and cause $XRP to post a relief pump from current levels. If this move does happen, the market has identified possible price levels to watch.
Key Points
- The golden pocket support has cushioned recent $XRP bearish price action and could provide the momentum needed to trigger a recovery.
- $XRP held up nicely around the 1.618 golden pocket Fibonacci level after a brief dump to the 0.65 Fibonacci level below.
- When the relief wave 4 rally starts, she identified the 0.382 Fibonacci level at $1.78 as the first resistance to watch.
- Reclaiming and holding the $2.03 psychological level may invalidate the corrective fifth wave that would lead to the imminent relief pump.
$XRP Wave Pattern
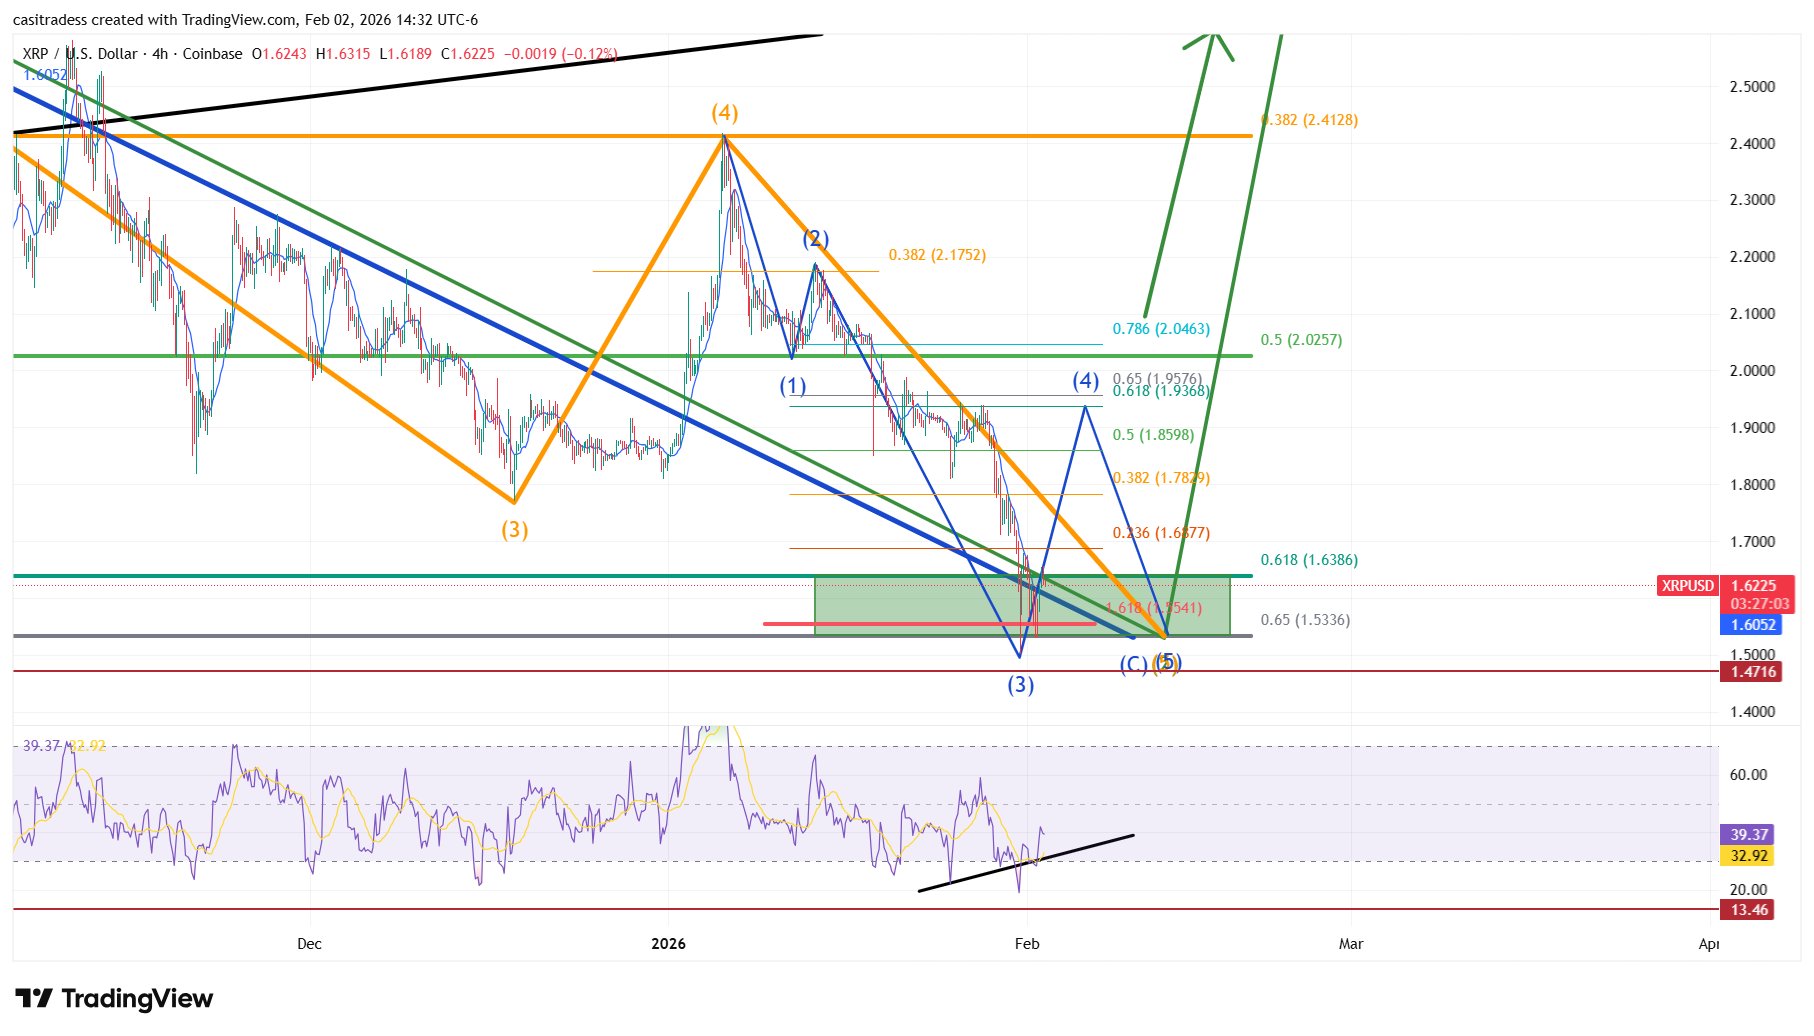
Experienced market trader CasiTrades explained in her February 2 market analysis that $XRP gave the market reset she was expecting. Her commentary highlighted that the coin has been following an Elliott Wave pattern, marked by periods of price declines and recoveries.
With several waves on her accompanying chart, her focus is on the blue-colored sub-wave pattern. Notably, this structure began to form from the early January high of $2.41 on the 4-hour price chart.
 $XRP Elliott Wave Pattern">
The first wave was corrective, forcing a pullback to $2.03 on January 12. Following this was wave 2, which saw $XRP rebound slightly to $2.19 two days later. Subsequently, the third wave started, again bearing bearish tidings for the coin. It was during this wave that $XRP dropped to the 0.65 Fibonacci around $1.53 before a recovery to the golden pocket Fibonacci level.
Support Around Golden Pocket
Meanwhile, $XRP has recovered to near the 1.618 golden support Fibonacci level at around $1.63 after a pullback to $1.52 on January 31. This has prompted CasiTrades to predict the end of corrective wave 3 and the start of a relief pump, aligning with wave 4.
When the relief rally starts, she identified the 0.382 Fibonacci level at $1.78 as the first resistance to watch. Notably, this level aligns with a former support level that $XRP broke through during corrective wave 3. Her chart shows that wave 4 would see the coin reach the 0.65 Fibonacci level at $1.95.
CasiTrades further highlighted that the second wave was shallow, which, in a typical Elliott wave pattern, suggests a longer wave 4. As such, the imminent relief pump could extend towards the 0.5 Fibonacci retracement at $2.03.
No Further Wave 5 $XRP Pullback? Caveat to Note
According to the analyst, reclaiming and holding the $2.03 psychological level may invalidate the corrective fifth wave that would ensue the imminent relief pump. This means it would not have to continue its downward move towards $1.55 or lower, which typically follows wave 4.
However, she stressed that nothing is confirmed at the moment. She highlighted a bullish divergence between price and RSI during this downtrend, but noted that $XRP would have to push past resistance levels to validate momentum.
Moreover, there is still no guarantee that even the wave 4 relief pump will occur. $XRP could still fall to lower levels if price weakness persists.