
Shiba Inu shows a short-term rebound, but broader momentum remains weak as traders watch whether bulls can hold key support zones.
Shiba Inu ($SHIB) is showing a short-term rebound, rising about 4.7% over the past 24 hours to trade near $0.00000685 after bouncing from intraday lows around $0.00000650. The chart shows a steady recovery through the session, with price briefly approaching the upper end of the daily range at $0.00000699.
Trading activity remains futures-heavy, with roughly $184.1 million in futures volume compared to about $40.7 million in spot volume over the last 24 hours. $SHIB’s market cap sits near $4.03 billion with open interest currently around $78.8 million.
Despite the daily gain, broader performance remains under pressure, as $SHIB is still down roughly 11% over the past week, more than 14% in the last 14 days, and about 18% over the past month. The question now remains: will Shiba Inu bulls defend key support to test further resistance ahead?
Can Shiba Inu Bulls Defend Key Resistance?
Shiba Inu has recently bounced off its lower Bollinger Band on the daily chart, which was acting as the immediate support zone, meaning the bulls have defended this support. As long as $SHIB remains above this lower volatility boundary, sitting at $0.00000657, downside pressure may stay contained, although a daily close below it would signal renewed weakness. It could also open the door to a deeper retracement toward prior consolidation zones like $0.0000062.
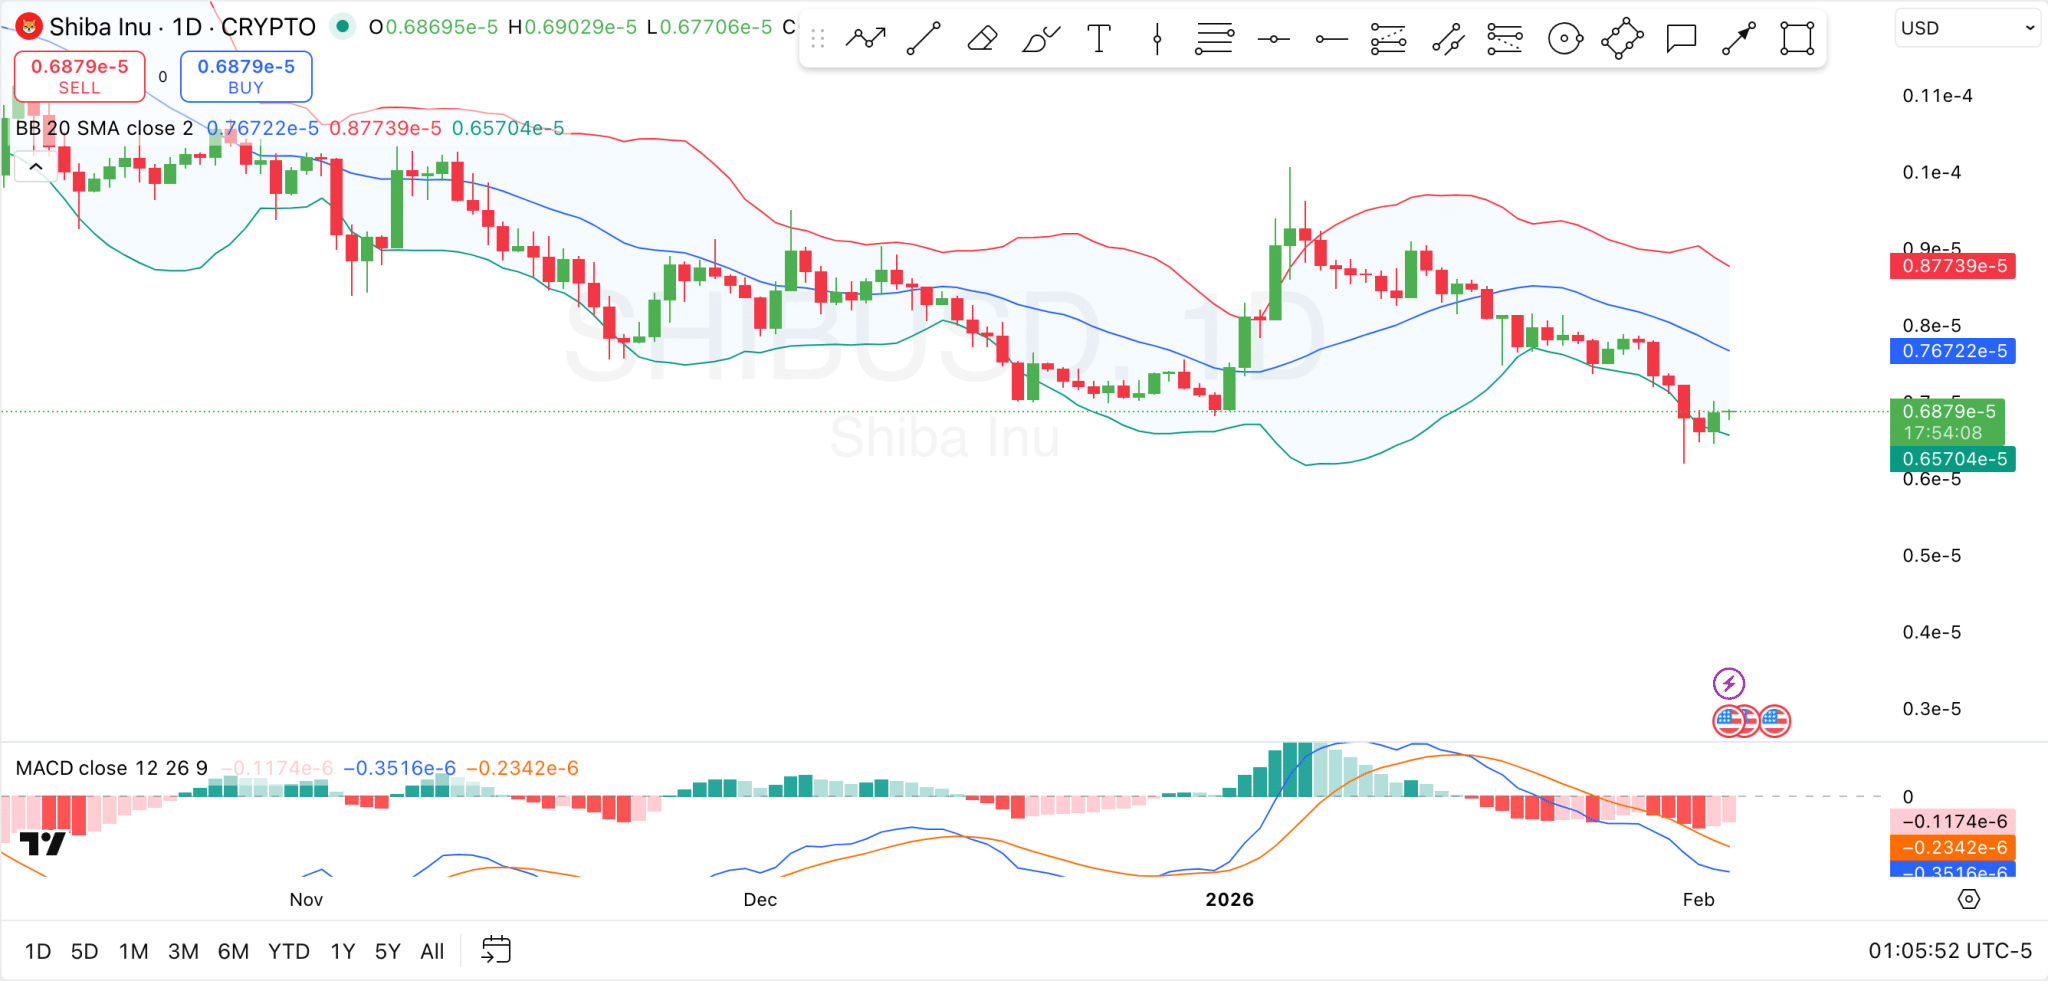
On the upside, $SHIB continues to face layered resistance from the Bollinger Bands’ midline at $0.00000767, which corresponds to the 20-day simple moving average. This level has previously capped multiple rebound attempts, reinforcing it as a key short-term barrier.
Above that, the upper Bollinger Band at $0.00000877 represents a stronger resistance zone, where price previously faced rejection. If $SHIB can breach this level, it could open the road to further highs like $0.00001, as long as support holds firm.
Meanwhile, momentum indicators remain cautious. Specifically, the MACD is firmly in negative territory, with the signal line below the baseline and histogram bars extending to the downside. While the selling pace has slowed compared to earlier sessions, there are no confirmed bullish crossovers yet. For sentiment to improve, traders will be watching for the MACD histogram to flatten and begin contracting, alongside a potential bullish crossover.
$SHIB’s Price Depends on This Support
In separate market commentary, Ali Martinez stated that Shiba Inu’s structure depends on holding above the $0.0000066721 level, which marks a major weekly support on the chart. This zone has repeatedly acted as a demand floor during previous consolidations.

If $SHIB maintains price action above $0.0000066721, it could launch to resistance levels like $0.0000148. However, a confirmed weekly close below this level would signal a breakdown of support and open downside risk toward the next zones near $0.0000029954 and $0.0000013522.