-
$XRP trades at $1.64 as analysts watch whether bulls can defend the critical $1.60 support zone.
-
Losing $1.60 could send $XRP down toward $1.15, a key trendline.
-
Holding $1.60 keeps $XRP’s bullish structure intact and allows for higher lows to form.
-
After four red monthly candles, history suggests a 70% chance $XRP rebounds this month.
$XRP is once again at a critical decision point, with analysts closely watching whether bulls can defend a key price zone that could determine the next major move.
$XRP is now trading at $1.64 after recovering slightly from a dip to $1.53 over the weekend. At this stage, the coin is approaching a pivotal moment.
Key Points
The Battle at $1.60 Intensifies
According to analyst Matt Hughes, the $1.60 level has become a must-hold zone for $XRP. This is because its price action continues to compress near long-term technical support.
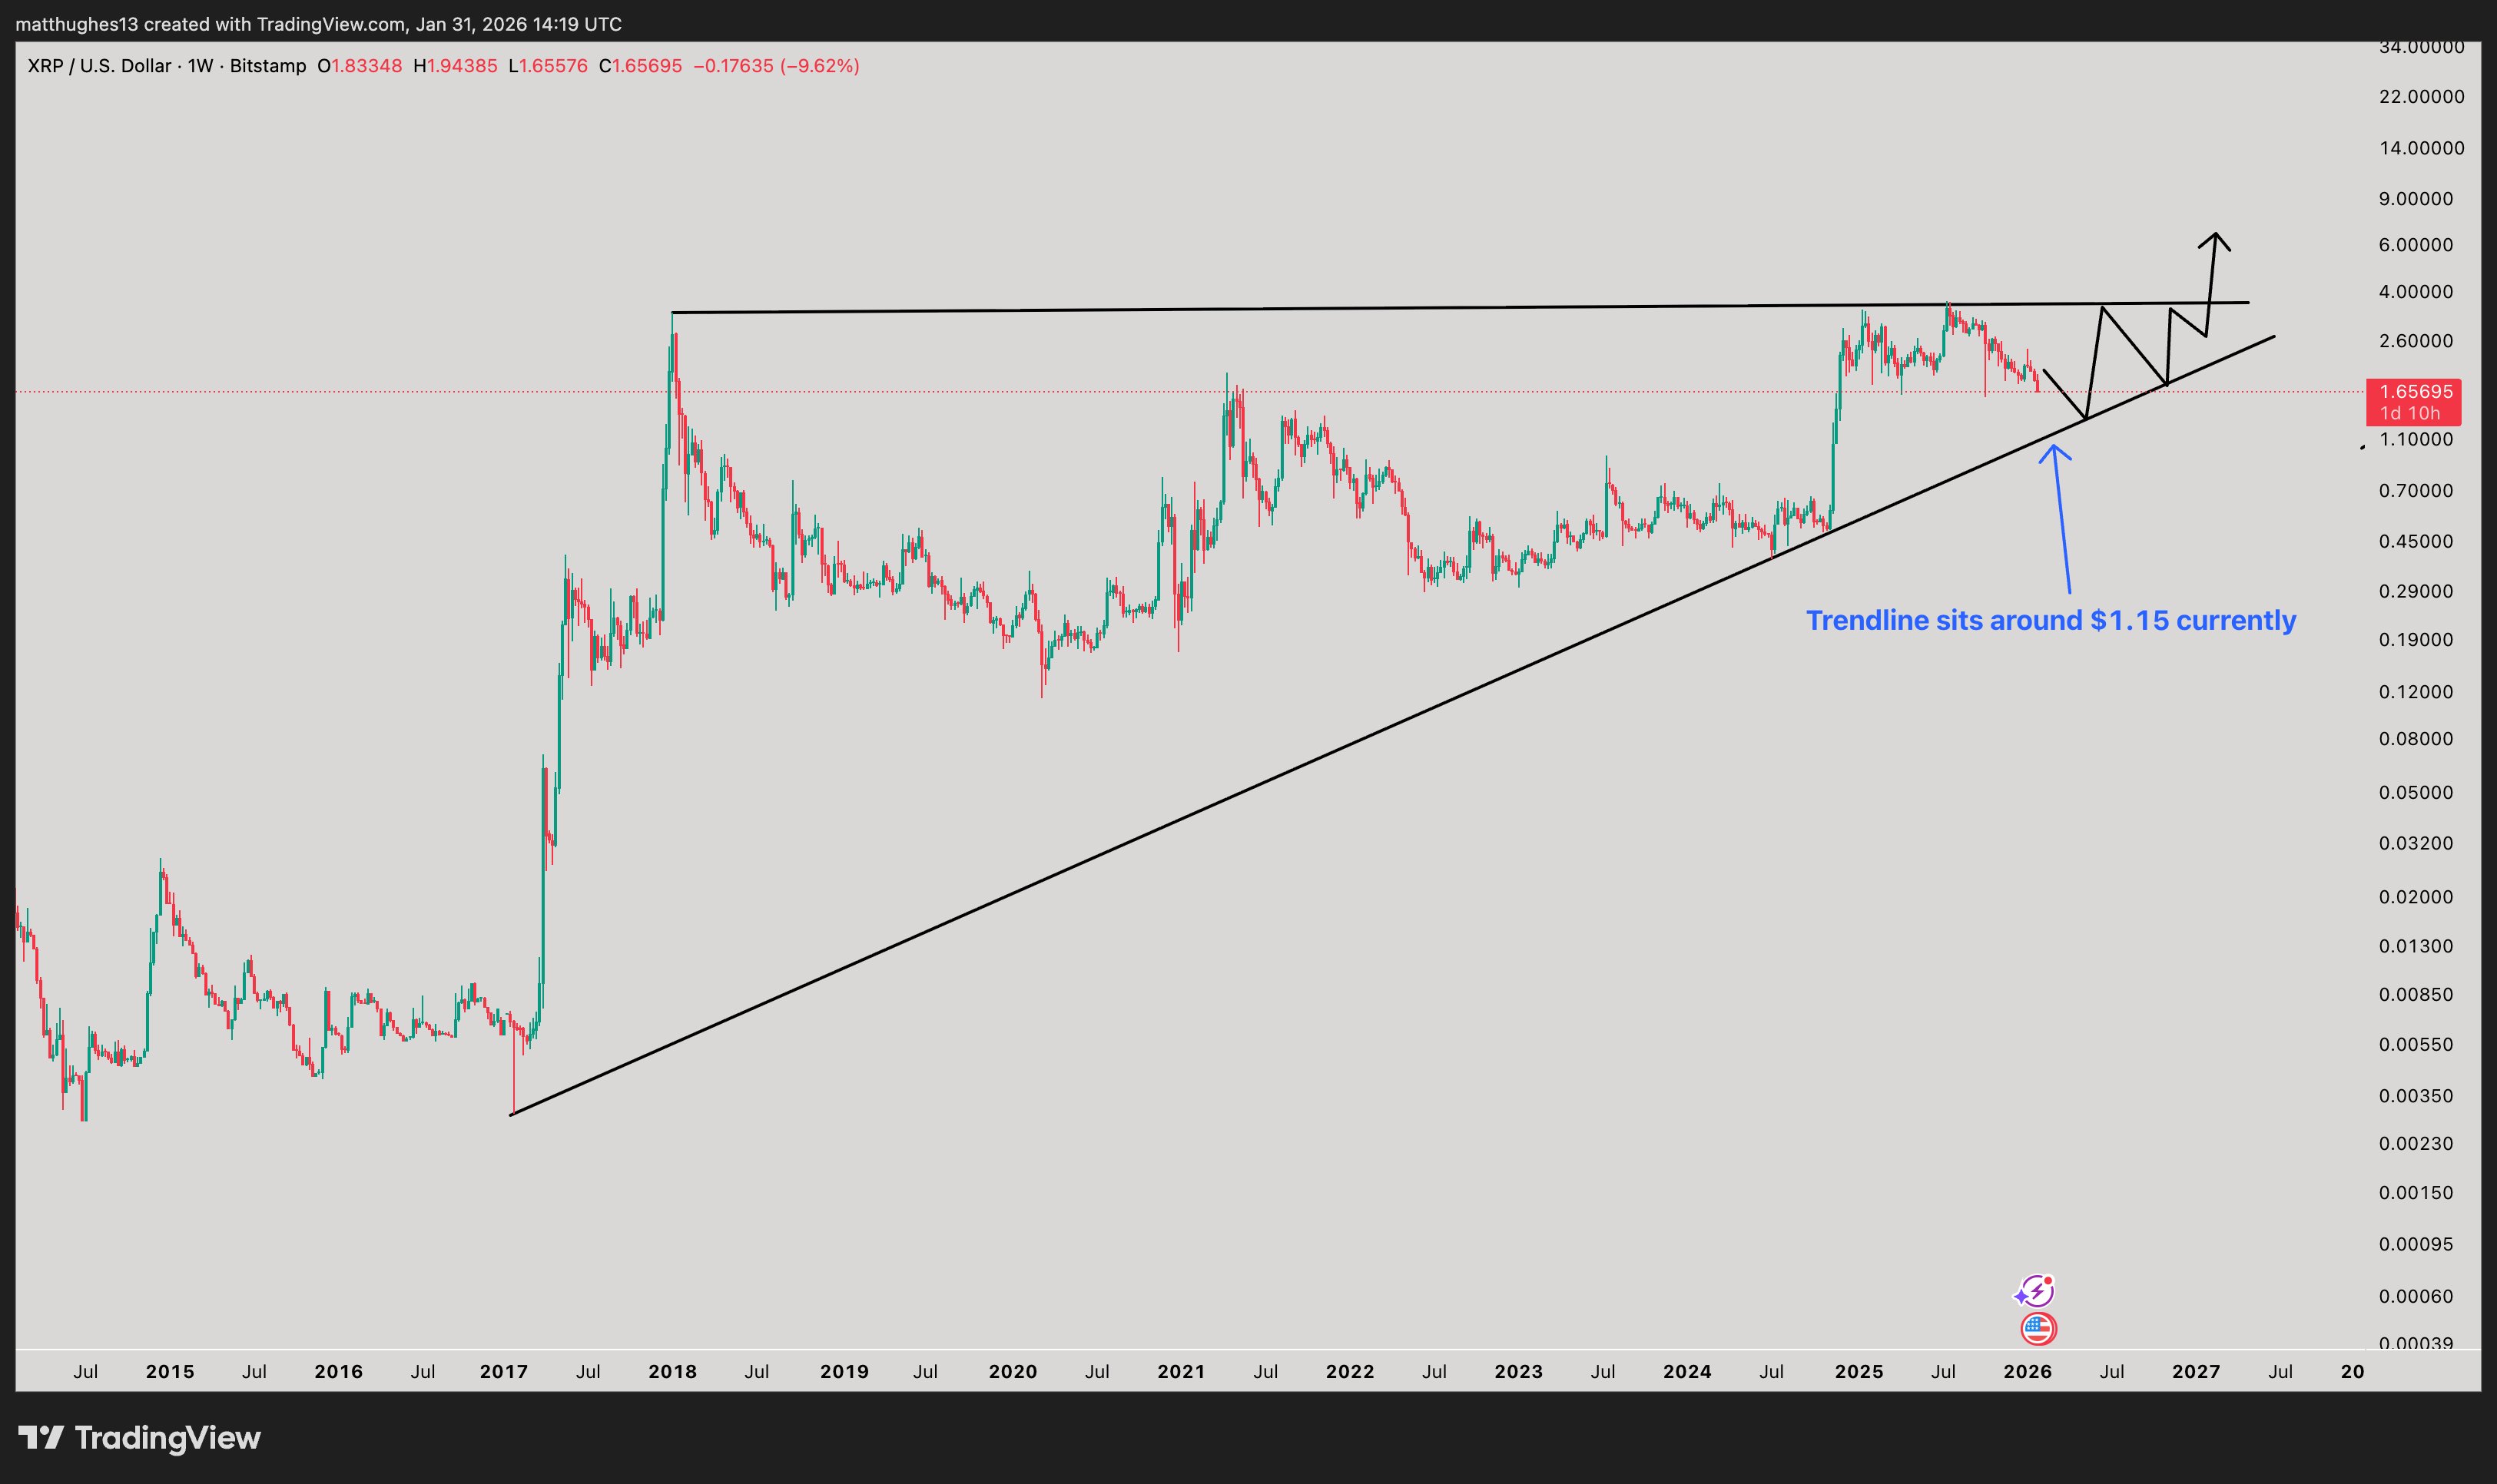
Hughes shared a long-term weekly $XRP chart showing the price grinding along an ascending trendline that has guided $XRP higher since the 2017 cycle. In a follow-up update, he described the situation as “the battle at $1.60,” emphasizing how important this level has become.
At the time of his analysis, $XRP was hovering just above $1.60, with multiple weekly closes testing buyers’ conviction. A sustained hold above this zone would keep $XRP within its bullish structure.
What Happens If $XRP Breaks $1.60?
The chart also outlines a more cautious scenario if support fails. If $XRP convincingly loses $1.60, Hughes’ illustration suggests the price could slide toward the rising trendline, which currently sits around $1.15.
Notably, a dip to $1.15 from $XRP’s current position would represent another 30% price decline. Compared to its 2025 peak of $3.66, such a move would amount to nearly a 70% drawdown.
On the bullish side, holding above $1.60 keeps the door open for $XRP to continue forming higher lows. Hughes’ projection shows a potential stair-step move higher if buyers regain control, eventually setting the stage for a push toward a new all-time high.
For now, all eyes remain on how $XRP’s price behaves around $1.60, as this level may determine whether the market stabilizes or slips into a deeper pullback.
“70% Chance of Rebound This Month”
Beyond this support level, other market watchers are turning to historical trends to call a potential $XRP bottom.
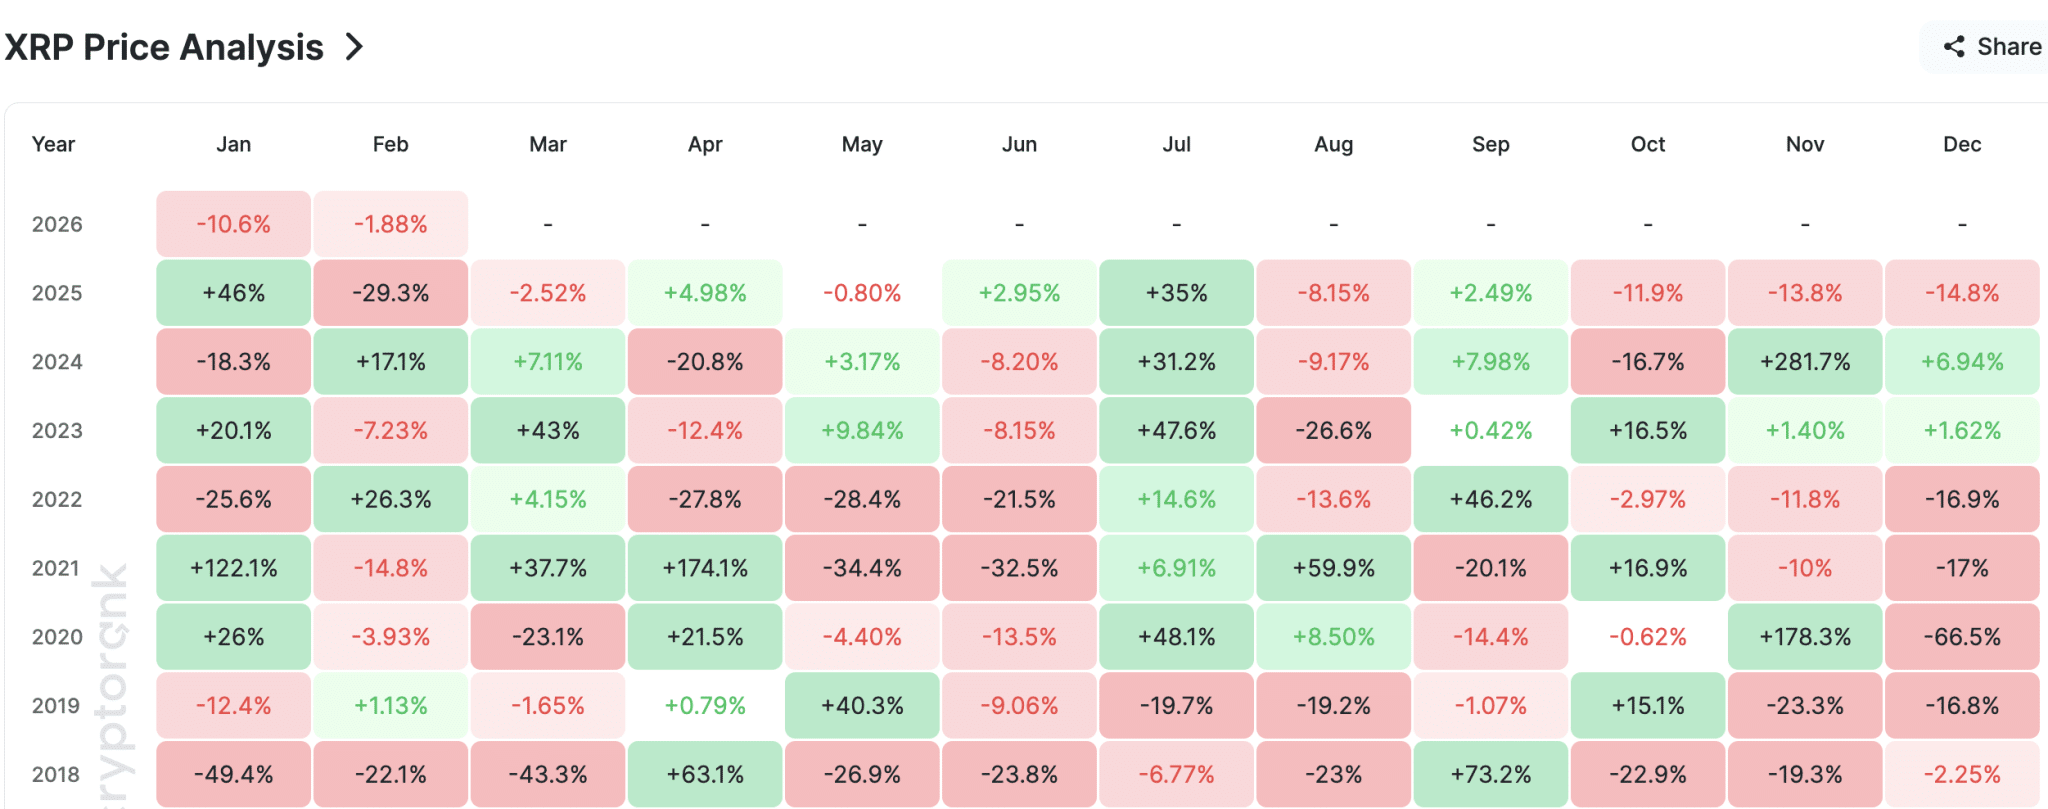
$XRP has now recorded four consecutive red monthly candles, a pattern not seen since 2017. The token closed January 2026 at $1.6455, down from an opening price of $1.84, and slipped further to $1.53 in early February.
Analyst Bird noted that $XRP has not posted five straight red monthly closes in nearly eight years. Historically, similar setups have favored a rebound, with past cycles showing roughly a 70% chance that the following month closes higher.
Previous periods of extended monthly losses often marked seller exhaustion. In both 2018 and 2022, multi-month declines were followed by strong green candles, including gains of up to 73% in the subsequent month.
$XRP Historical Chart
But broader market conditions, particularly Bitcoin’s trend and overall sentiment, could still influence outcomes. For now, history suggests February is more likely to break the losing streak.