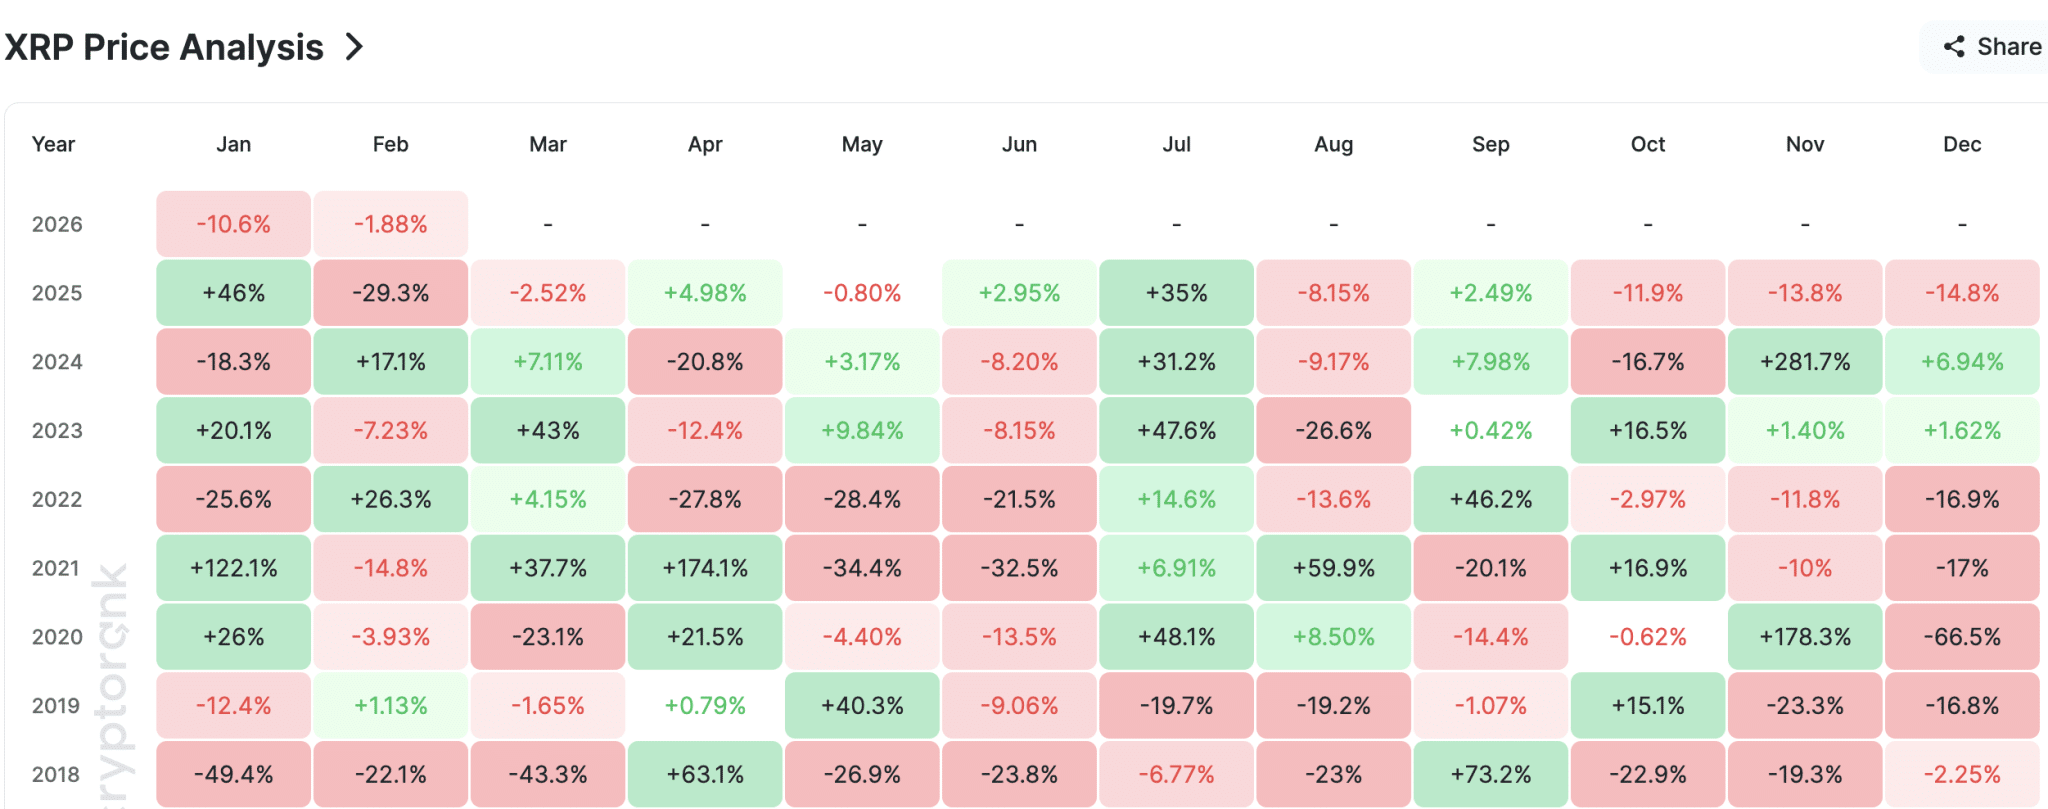
$XRP may be approaching a key turning point after recording four consecutive red monthly candles, a pattern that has not appeared in nearly eight years.
Notably, $XRP closed January 2026 at $1.6455, after opening the month at a much higher level of $1.84. Starting February, $XRP has already dipped further, reaching as low as $1.53, a price point last seen in October 2025.
$XRP’s latest negative monthly close marks the fourth consecutive month it has closed lower than it opened. Meanwhile, historical data suggests the odds now favor a reversal rather than a continuation of losses.
Key Points
-
$XRP posts 4th red month in a row, a streak unseen since 2017.
-
Historical data gives $XRP a 70% chance to close February higher.
-
Past cycles show long red streaks often precede a relief rally.
-
$XRP trades at $1.60, aiming to recover from its recent dip.
Rare Pattern Not Seen Since 2017
XRPL developer Bird highlighted $XRP’s fourth consecutive monthly negative close in a post on X. He noted that $XRP has not printed five red monthly candles in a row since 2017. Over the past eight years, similar conditions have consistently led to a green monthly close.
Based on past data, Bird said the probability of $XRP closing a fifth straight red month sits at roughly 30%, implying a 70% chance that February breaks the streak and finishes higher.
History Favors $XRP Bounce, Not More Selling
Previous cycles show that prolonged monthly weakness in $XRP often signals seller exhaustion. Historically, after three or four consecutive months of losses, the following month often turns green.
For instance, in 2022, $XRP closed April, May, and June with losses ranging from 21% to 28.4%, then posted 14.6% gains in July. Later that year, it recorded losses from October to December and posted 20% gains in January 2023.
In 2018, $XRP posted losses of 26.9%, 23.8%, 6.77%, and 23% from May to August. By September, it surged 73%. The trend repeated later that year, with losses from October to January, followed by a 1.13% gain in February 2019.
The monthly chart highlights how extended red streaks have often aligned with accumulation phases preceding a relief rally.
Market Context Still Matters
While historical probabilities lean bullish, broader market conditions remain a key factor. Bitcoin’s direction, overall crypto sentiment, and liquidity trends could influence whether $XRP follows its historical pattern or deviates from it.
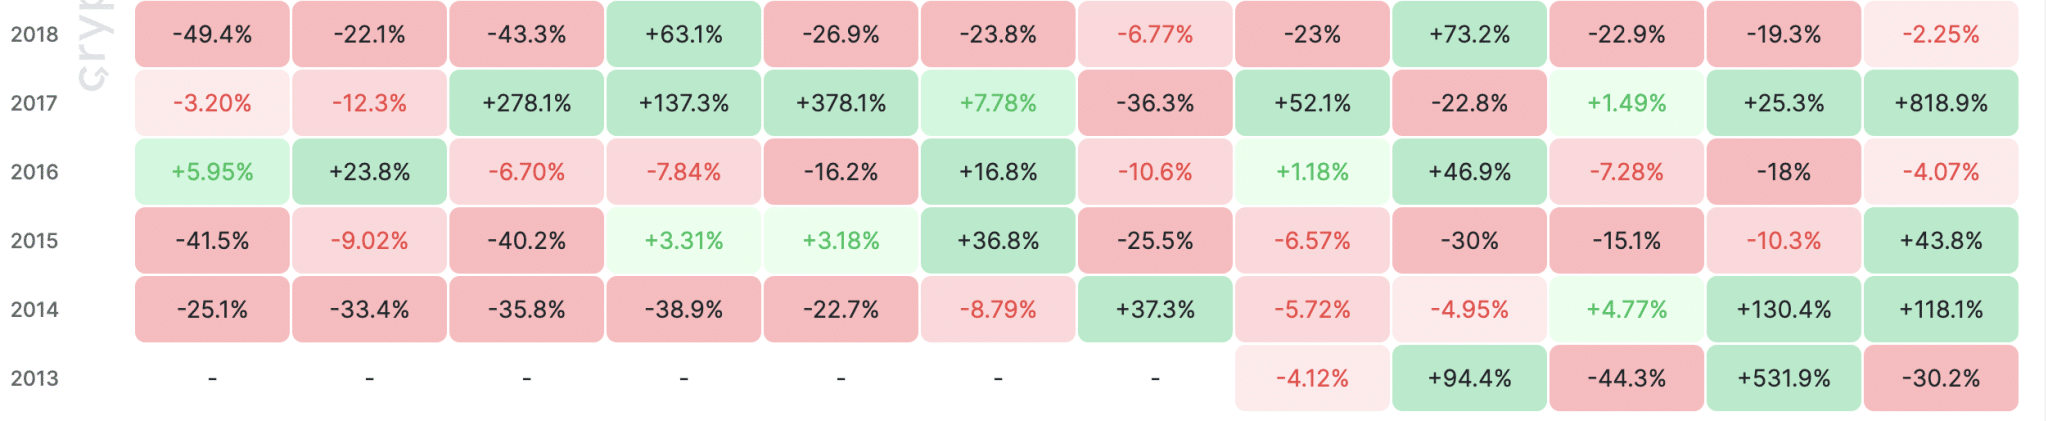
Moreover, in 2015 and 2014, $XRP recorded streaks of five and six consecutive monthly losses, respectively, before gains of 43.8% and 37.3%. This suggests that while there is optimism for a rebound in February, $XRP’s price could still close the month in red.
Still, the rarity of the current setup has drawn attention from traders who view February as a pivotal month for $XRP’s medium-term direction.
For now, history suggests the odds favor a break in the losing streak and a potential shift in momentum for $XRP. The coin is currently trading at $1.60, attempting to recover from the latest dip.