$XRP bearishness has extended into February, with the asset breaching key support levels and analysts now projecting a possible further drop toward the $1 zone.
In this context, market analyst Ali Martinez has outlined a clear technical framework suggesting the token could slide further if current conditions persist.
In an X post on February 1, the analyst based his outlook on $XRP’s weekly charts, which show the token locked in a prolonged downtrend after failing to sustain momentum above the $3.40 region earlier in the cycle.
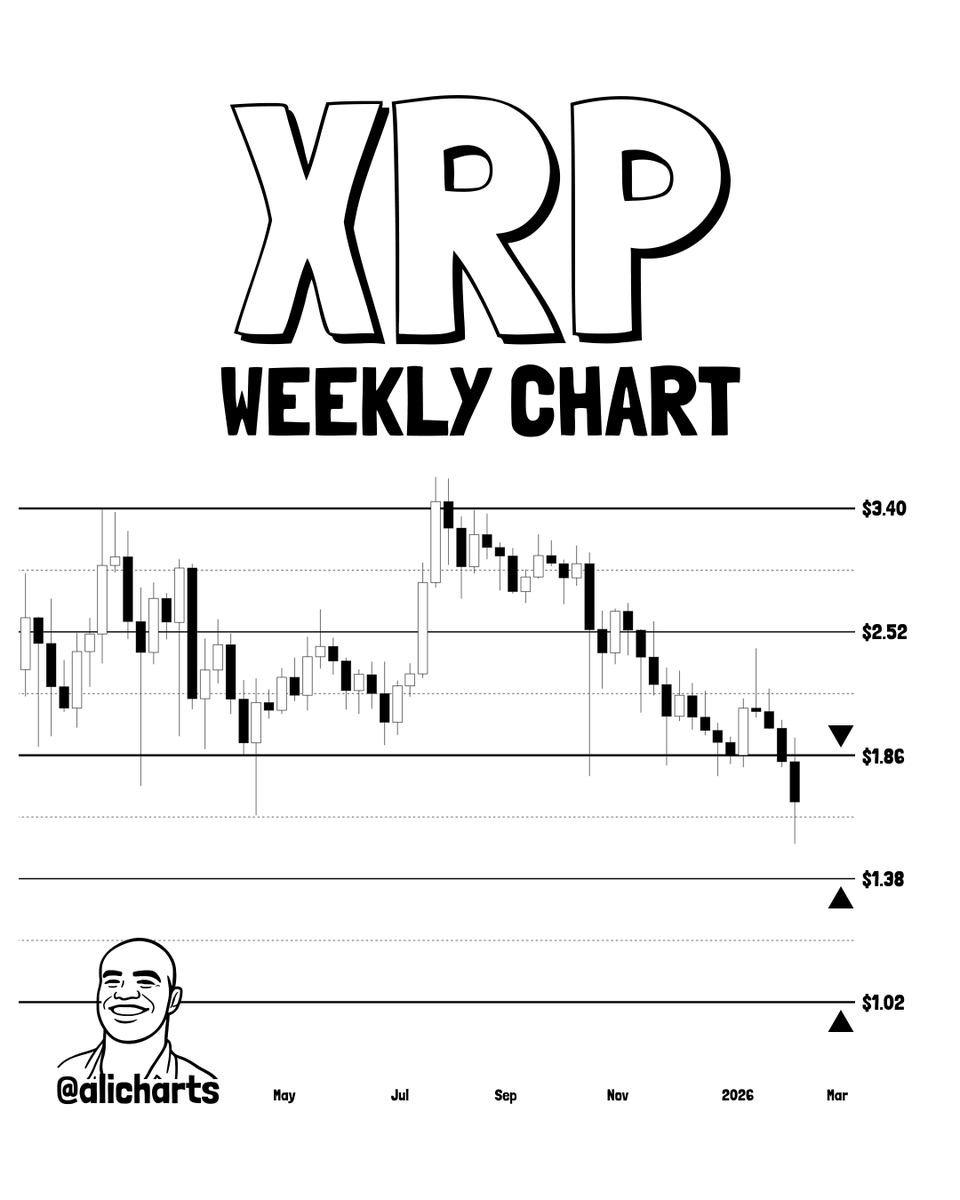
That rejection marked a major macro top, followed by a steady sequence of lower highs and lower lows. Price action has since deteriorated, with $XRP recently slipping below the $2.52 mid-range level that previously acted as a consolidation zone, confirming a broader loss of bullish structure.
According to Martinez’s assessment, resistance is firmly established at $1.86, a level that aligns with prior weekly support turned resistance.
Indeed, the outlook points to multiple failed attempts to reclaim this area, reinforcing it as a ceiling that sellers continue to defend. As long as $XRP remains below this threshold, upside recoveries are likely to be capped and vulnerable to renewed selling pressure.
$XRP’s downside target
On the downside, the analysis highlighted $1.38 as the next major support, corresponding with a historical demand zone that previously triggered short-term rebounds. A decisive weekly close below this level would weaken the remaining bullish defenses and open the door to a deeper decline.
Below $1.38, the final notable support sits near $1.02, a level that closely aligns with the psychological $1 mark and represents the last major floor before a potential breakdown into uncharted bearish territory.
This outlook comes as $XRP continues to struggle in tandem with broader cryptocurrency market sentiment.
The decline tracks heavy losses across the market, with Bitcoin (BTC) falling below $75,000. Key drivers of the downturn include macroeconomic uncertainty, Fed leadership changes raising fears of prolonged high interest rates, geopolitical tensions, a partial U.S. government shutdown, and capital rotating toward safer assets.
Overall, no major Ripple-specific negative news has emerged to drive the current price drop.
$XRP price analysis
By press time, $XRP was trading at $1.59, having plunged about 4.5% in the past 24 hours, while on the weekly timeframe, the asset is down nearly 16%.
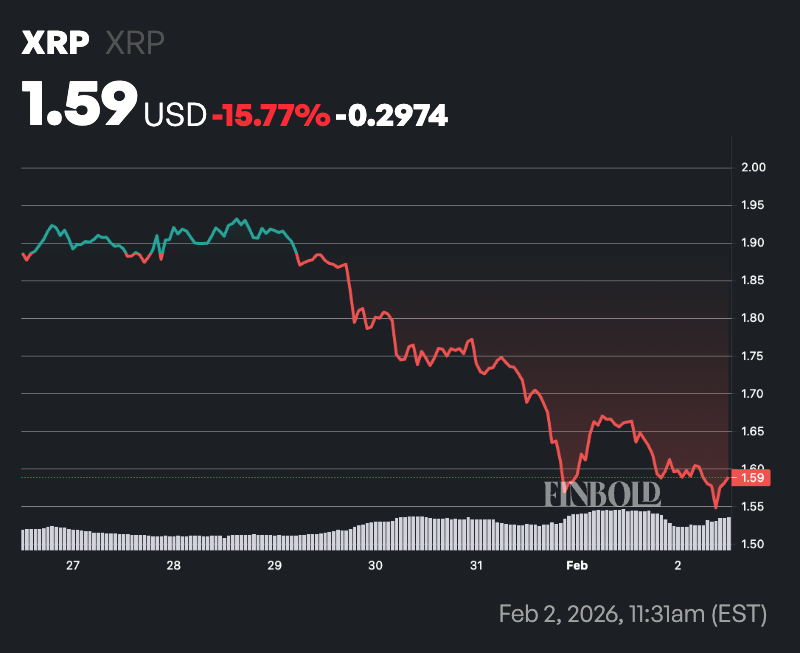
At current levels, $XRP is well below both key moving averages. The price sits far under the 50-day SMA at $1.96 and the 200-day SMA at $2.46, signaling sustained downside momentum and a lack of trend support in the medium to long term.
At the same time, the 14-day RSI at 27.36 places $XRP deep in oversold territory. This suggests selling pressure may be stretched and raises the probability of a short-term technical bounce.
However, with price still decisively below both SMAs, any rebound is likely corrective rather than a confirmed trend reversal unless $XRP can reclaim the 50-day average with follow-through.
Featured image via Shutterstock