TL;DR
- Solana trades around $117, with critical support at $116 preventing a drop toward the $100-$106 range.
- Key resistance levels are at $130-$136 and $142-$147 to confirm an upward trend.
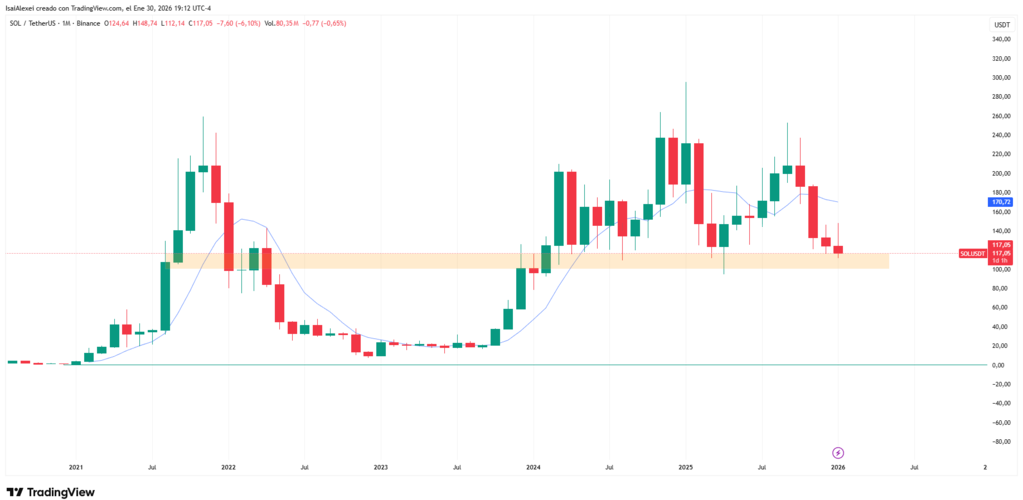
- February’s historical seasonality is positive, with bullish targets possible in the $165-$200 range.
Solana enters February 2026 trading around $117, with a critical support at $116 and seasonal upside potential if it resists recent bearish pressure. The token registered a daily change of -0.53%, equivalent to a drop of $0.63.
The day’s trading range oscillated between $111.79 and $118.94, placing it below the 50-day moving average ($130.40) and the 200-day moving average ($170.95). Market capitalization hovers around $65.99 billion, with a volume of $213 million in daily operations.
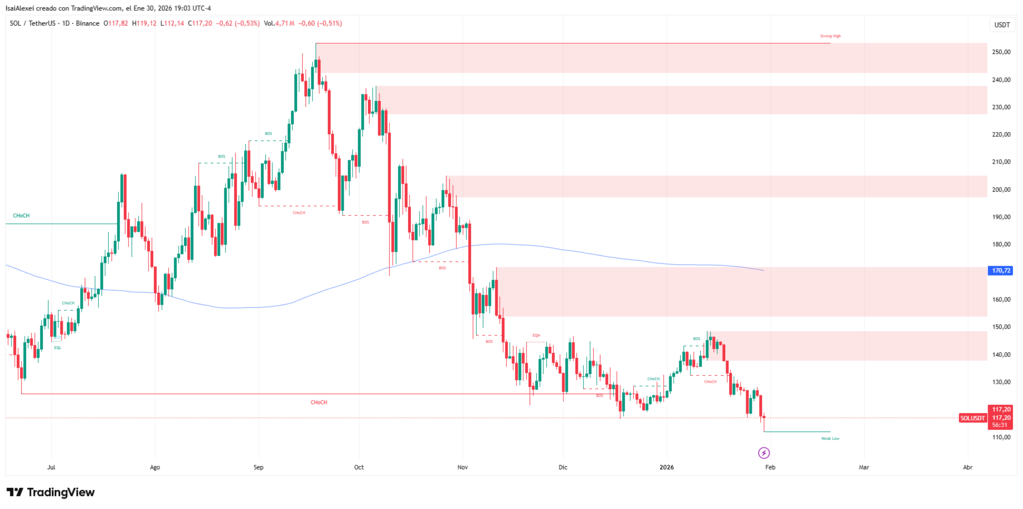
Technical analysis identifies $116 as the immediate macro support. Breaking that level would open the possibility of a drop toward the $106-100 range. An additional structural zone sits between $112 and $121, a level traders watch to determine bearish invalidation.
Resistances and Upside Targets for the Month
The first resistance is found in the $130-136 range. A close above that zone would favor bullish momentum. The second barrier appears between $142 and $147, a level that would confirm an upward trend although it could generate profit-taking by traders.
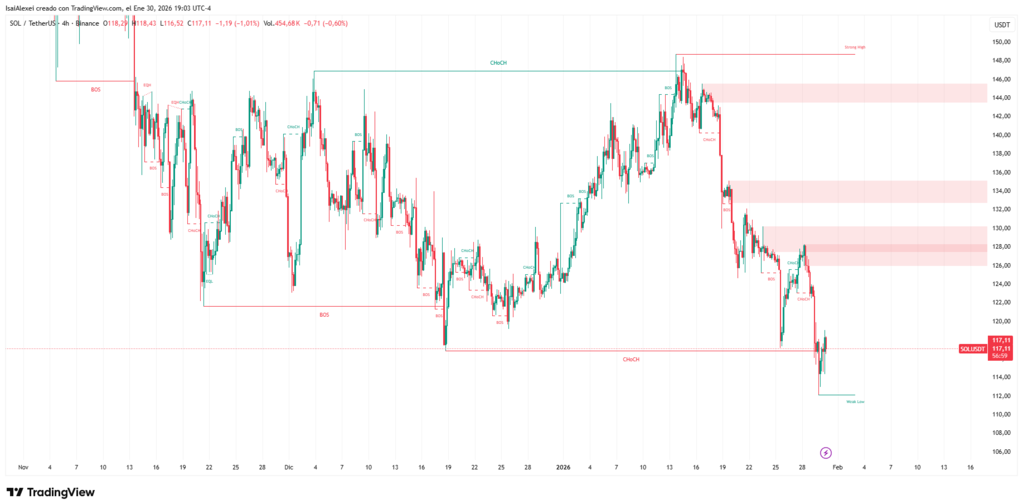
The optimistic scenario projects targets between $165 and $200, backed by February’s positive historical seasonality, which shows average returns of approximately 38% and a historical ROI of 71% under favorable conditions.
Monthly predictions vary according to the source consulted. Binance projects a range between $131 and $200, with an average of $166. Changelly estimates prices between $140 and $150, with an average of $149 and month-end close at $139.
The base scenario contemplates consolidation in the $120-140 range if supports hold. However, there is downside risk toward $100 if Solana loses the $116 level.
Onchain activity shows strength, supporting the current price floor. Active addresses exceed 5 million and transactions reached 87 million daily during January. Onchain data suggests constant demand for the network despite mixed market conditions.
Market sentiment presents contradictory signals. The Fear & Greed index marks 29 points, indicating fear among investors. The RSI remains neutral at 37, signaling conditions that are neither overbought nor oversold. However, institutional flows and historical seasonality favor a possible rebound.
Risks include macro weakness in the general crypto market and monthly volatility of 5.25%. Traders should watch the behavior of Bitcoin and ETF flows, as both factors directly influence the performance of altcoins like Solana.
Solana Records Institutional Maturation as Firedancer Adoption Advances on Mainnet
Solana’s narrative changed substantially since the complete Firedancer validator client activated on mainnet in December 2025. Although adoption continues ongoing, early 2026 marks the phase where the client stopped being theoretical. Validators are actively migrating their stake, increasing client diversity and reducing single points of failure.
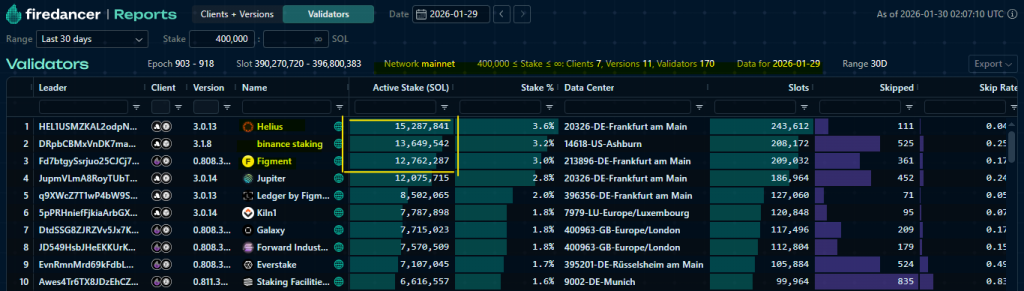
The transition proves fundamental, as true network resilience will only emerge when a supermajority participates. According to data from reports.firedancer.io, validators have so far reached 170, with the main active stakers being Helius, Binance Staking and Figment, which collectively staked around 31.5 million $SOL tokens on mainnet.
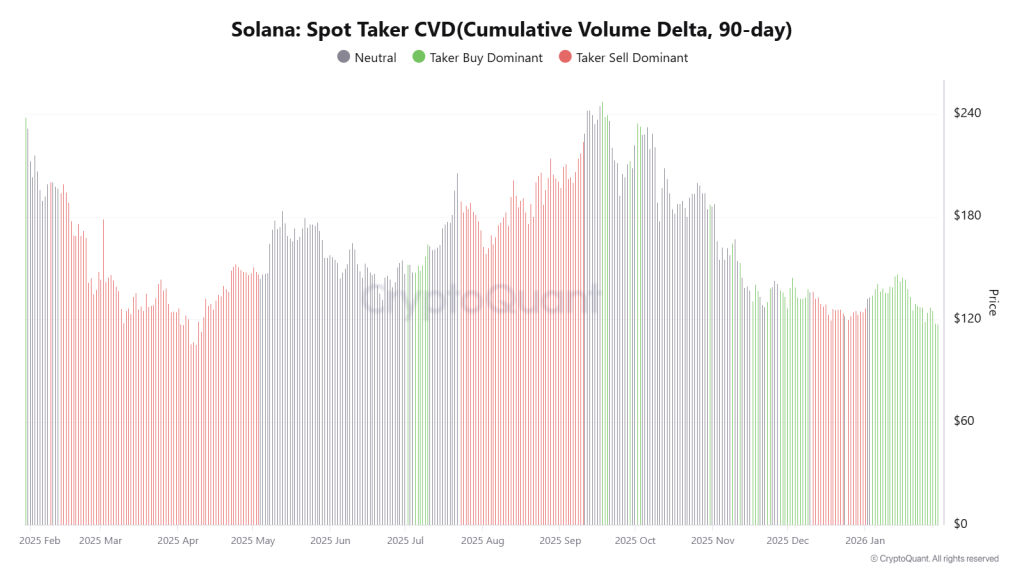
Onchain demand metrics strengthen simultaneously. The 90-day spot Taker CVD remained aggressively buy-dominant since early January, even when price temporarily crashed. Historically, the alignment suggests conviction-led accumulation rather than reactive short covering. In the current context, red market conditions resemble more of a shakeout than distribution.
Ecosystem Growth Backed by Concrete Data
Network growth data reveals that new Solana addresses climbed from 1.25 million to a peak of 1.86 million on January 12, indicating sustained onboarding. Daily active addresses executing $SOL transactions increased to 4.87 million, nearly doubling from early January levels.
From a revenue perspective, fees exceeded 11,000 $SOL on January 26 and ended the month above 9,400 $SOL, more than doubling since the start of January. The increase coincided with a sharp rise in developer participation, as newly deployed Solana programs rose from 226 to 544 within weeks. The growth signals developers implementing real applications, not just experimental contracts.
Stablecoin activity became one of the clearest demand drivers. According to DefiLlama, $USD1’s market capitalization surpassed $5 billion, with more than $610 million circulating on Solana alone. Monthly growth near 300% positions Solana as the fastest-expanding $USD1 chain, reinforcing its position as a preferred settlement layer.
Real-world asset (RWA) tokenization by major funds and the launch of GhostSwap by GhostwareOS introduced new capital flows and privacy-focused use cases. Together, the developments suggest ecosystem depth rather than cyclical hype.
GhostSwap is now live.
A private cross-chain swap experience designed to let users move assets into Solana without exposing transaction metadata.
Built to extend privacy-preserving workflows for the Solana ecosystem.https://t.co/5MEy3yULAg pic.twitter.com/tmJdKYQJk4
— GhostWareOS (@GhostWareOS) January 29, 2026
From a structural perspective, Solana price analysis shows it faces well-defined levels. The token could bleed more or possibly experience a liquidation grab with a long-wicked hammer candle that traps bears.
However, one point remains clear: the token’s current price is not aligned with the ecosystem’s optimism, and represents a clear divergence. The market tends to auto-correct, and after the noise dies down, it will enter a recovery rally to readjust from an undervalued state to an improved state. At that point, the divergence will decrease.
The combination of growing Firedancer adoption, strengthened onchain metrics, stablecoin expansion and active developer participation contrasts with current price conditions, creating a disconnect the market will likely correct in the coming weeks.