Shiba Inu has broken key support, now acting as resistance, with further declines imminent unless the price reclaims resistance levels.
Notably, Shiba Inu ($SHIB) has faced a significant 4.6% decline over the past 24 hours, with its price currently changing hands at $0.000007236. During this period, $SHIB has fluctuated between a floor of $0.0000071 and a high of $0.0000076, showing a general downtrend.
The token’s performance in the last week has been worse, with a decline of 8.6%, and a 14.1% drop over the last 14 days. However, Shiba Inu has experienced a 2.1% pump in the past month.
Despite the short-term struggles, $SHIB has outperformed in comparison to Bitcoin and Ethereum, with its price showing a positive ascent against both leading cryptos.
Shiba Inu Price Prediction
In the Shiba Inu daily chart, the price has broken below $0.00000748 at 0 Fibonacci level, which was previously acting as a key support. This level indicates that bulls are under pressure, and further declines could follow if this previous support continues to hold as resistance. The next potential support zone lies around the $0.0000069 level, which could offer some reprieve if the price continues to drop further.
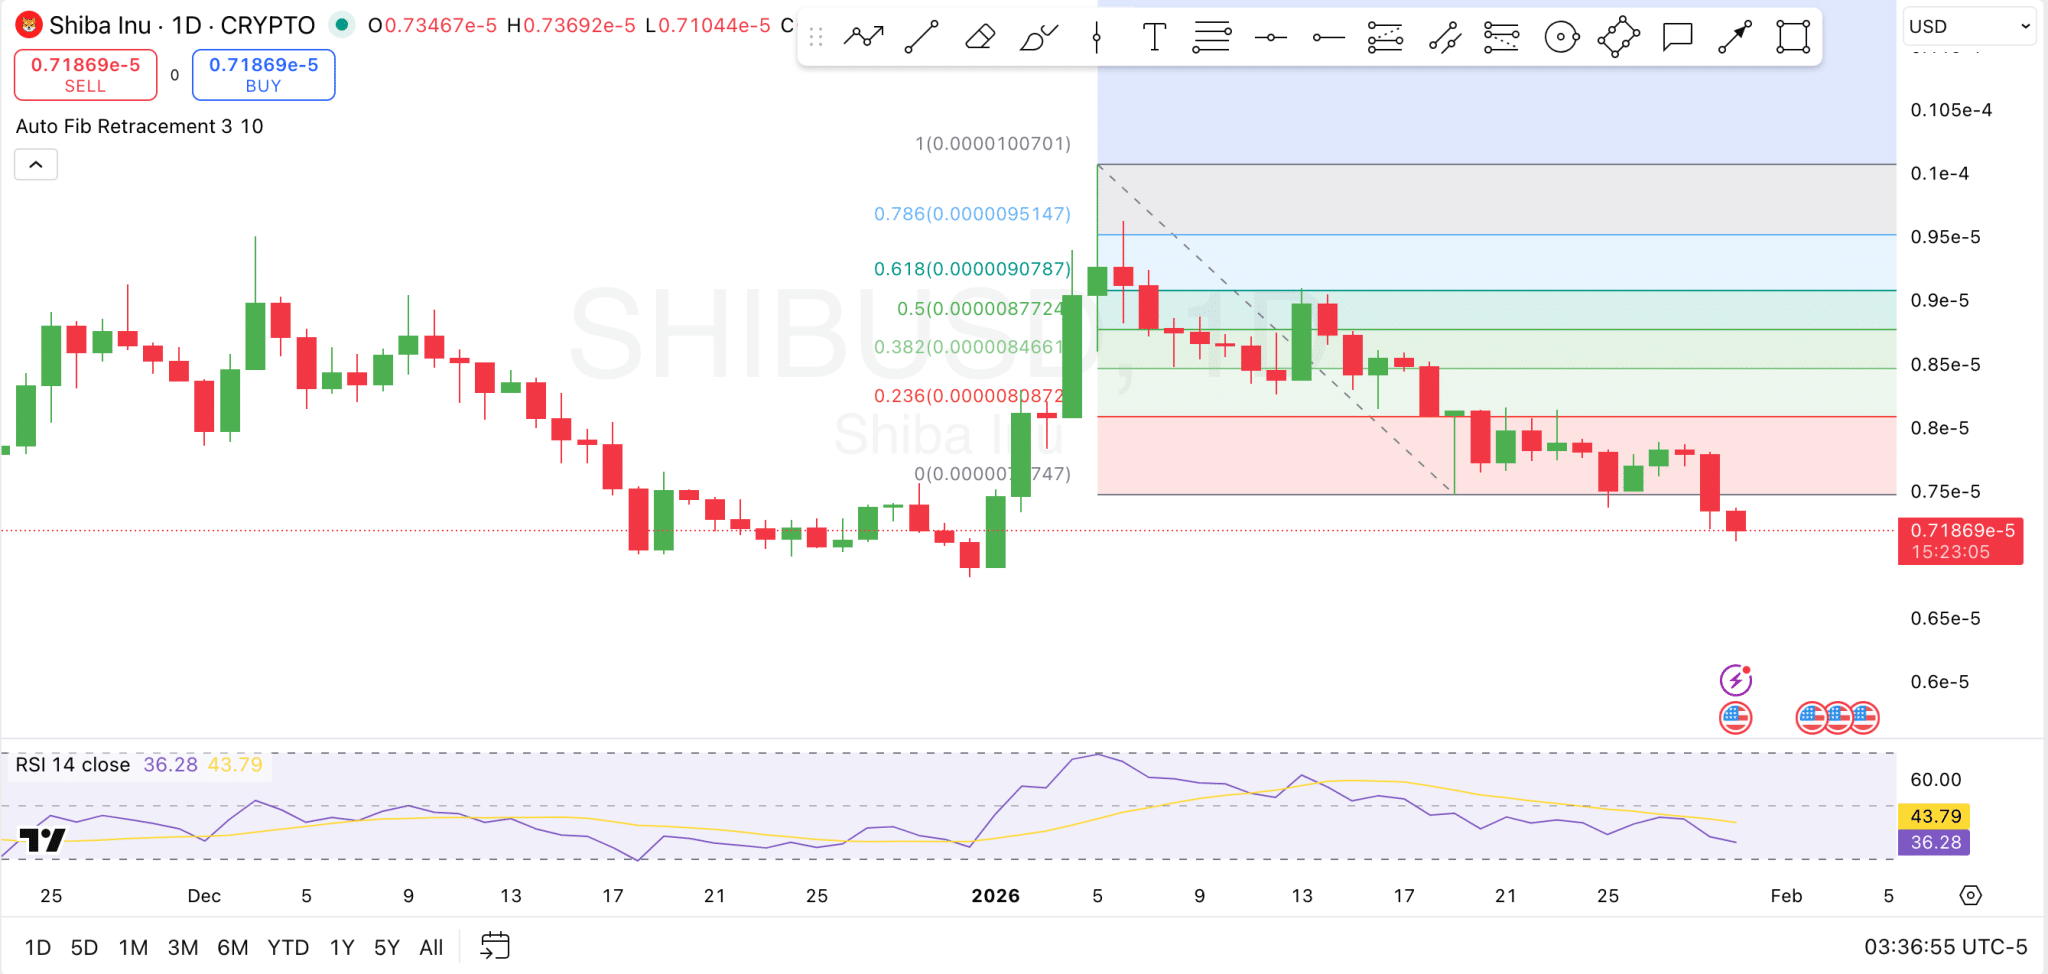
Looking at the resistance levels, the price is still below the 0.236 Fibonacci retracement level at $0.00000809. Shiba Inu must reclaim this area to confirm any upside movement. Until the price crosses above this level, any recovery may be limited. The key resistance above this is the 0.5 Fibonacci level at $0.000008772, and breaking this level would signal a stronger bullish move toward higher Fibonacci levels.
The Relative Strength Index is currently at 36.28, suggesting a lack of clear momentum in either direction. Traders will look for the RSI to approach the oversold zone below 30 for a potential reversal.
If the RSI starts turning upward, it may indicate an upcoming bullish momentum. However, if the RSI remains under 50 and trends further downward, Shiba Inu may continue its struggle below current support levels.
Shiba Inu Liquidation Data
The Shiba Inu total liquidations chart from CoinGlass reveals key details about where futures traders are leaning. Over the past few months, the chart illustrates a significant amount of liquidations, particularly in long positions, shown by the green bars.
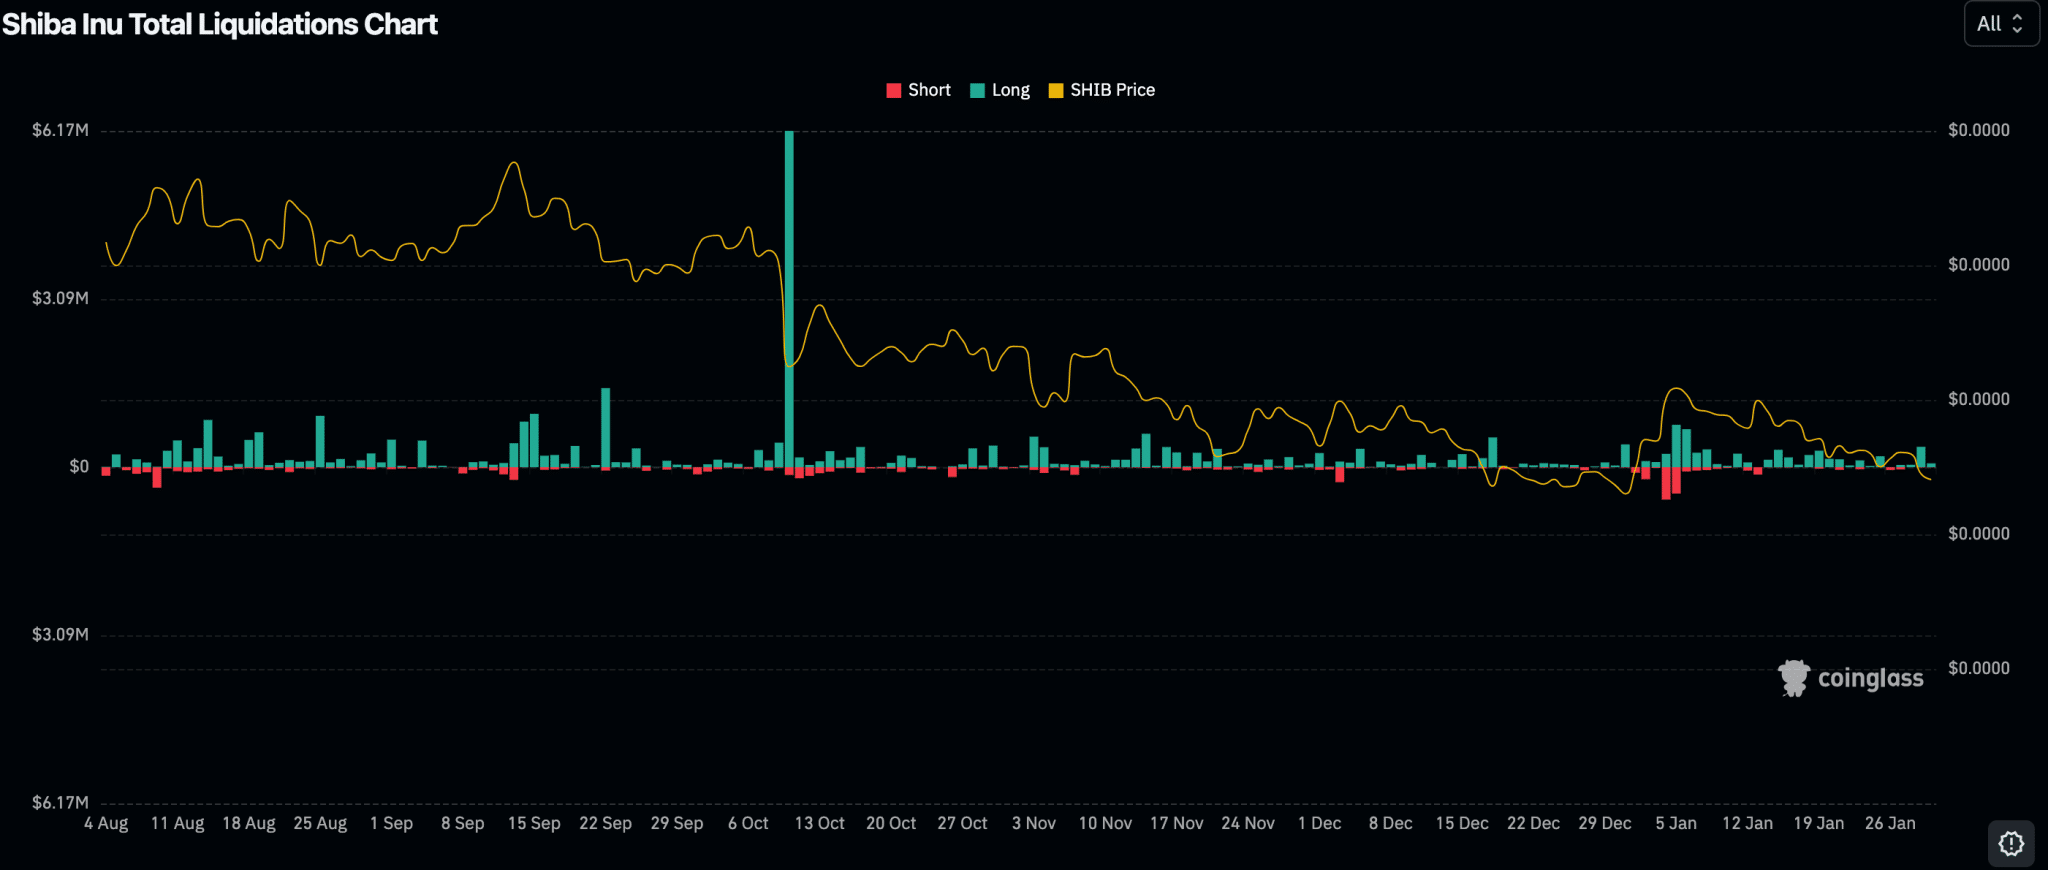
However, liquidations have remained relatively stable, with no large spikes recently. The dominant closing of long positions and the overall downtrend in price point to a lack of buying momentum, meaning that more long traders are getting caught in the downward move. However, it also shows that futures traders have mostly leaned towards long trades.