The chart highlights a sharp decline in price over the past few days, with the token losing momentum after an earlier-week surge. Despite this, $DOGE has managed to stabilize above the $0.121 support level, which traders will be closely watching to see if it can hold.
Can $DOGE Support Hold?
In the daily Dogecoin chart, the Supertrend indicator plays a pivotal role in identifying key levels for potential price movement. Currently, the price has broken below the lower boundary of the Supertrend at $0.12658, which has been acting as a barrier to bearish momentum.
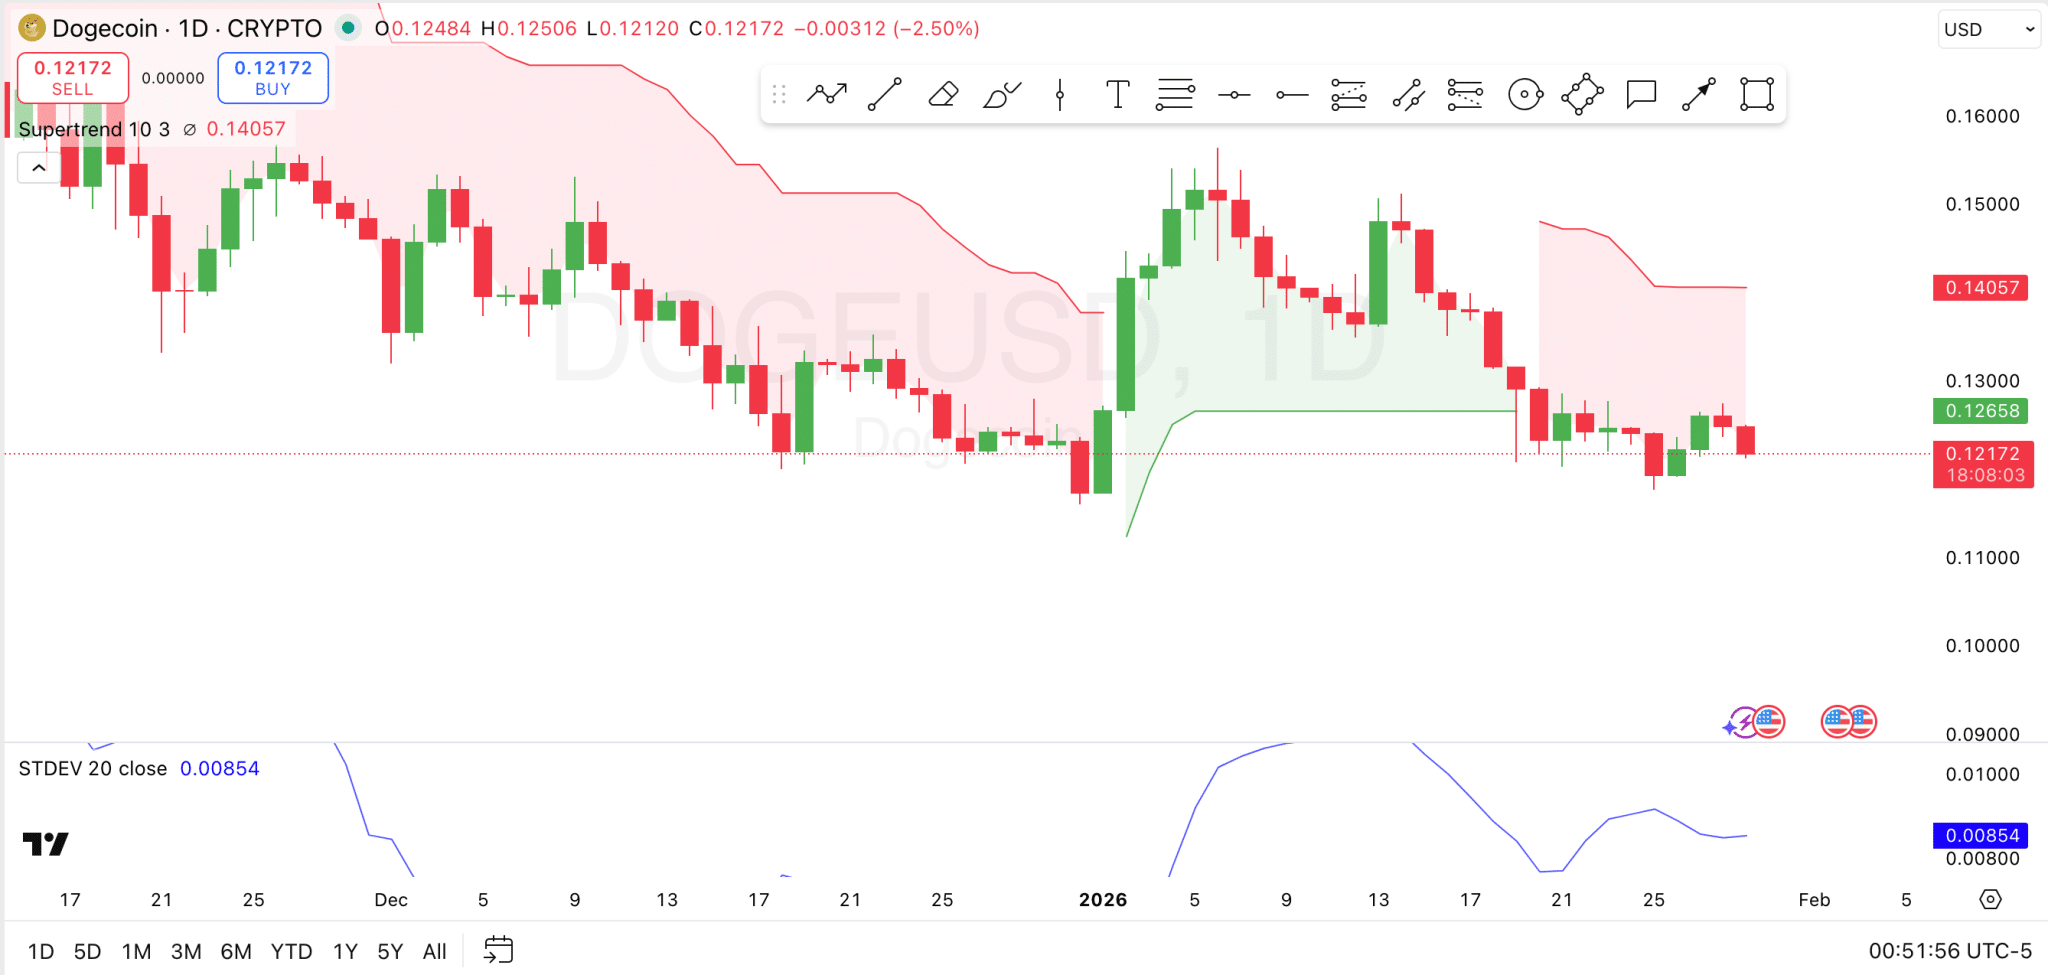
Dogecoin 1 Day Analysis
$DOGE bulls will be aiming to breach this level for a bullish move toward the upper boundary of the Supertrend indicator at $0.14, now acting as the major resistance. If successful, this could lead to a further rally to levels like $0.156, but failure to break the resistance could result in a rejection, causing a potential pullback.
The Standard Deviation indicator below the chart shows declining volatility, which suggests that $DOGE’s price movement may continue within this narrow range until a breakout or breakdown occurs. Traders should keep an eye on the Supertrend levels, as breaking either the resistance or support will likely dictate the next significant price move.
Dogecoin Breaks Key Trendline Resistance
Analyst Trader Tardigrade recently shared on X that Dogecoin on the 4-hour chart appears to be forming a Diamond Continuation Pattern. This comes after breaking a key resistance trendline just below the $0.1230 level.
The breakout from this resistance suggests that Dogecoin is now aiming for the continuation pattern, and hence the next target at around $0.1290. To reach $0.129, Dogecoin must surge by over 5.8% from the current price of $0.1219.

 thecryptobasic.com