The recent Shiba Inu price action has shown a striking resemblance to that of Dogecoin in 2021, sparking speculation of a similar move.
Notably, the two charts, placed side by side, show a similar period of price consolidation around a key support area. From this area, Dogecoin built the required momentum for its impulsive move, suggesting that $SHIB could record a similar shift.
Key Points
- The recent Shiba Inu price action has shown a striking resemblance to that of Dogecoin in 2021, sparking speculation of a similar move.
- Shiba Inu has maintained a key support area around $0.0000068 to $0.0000061 throughout its lifespan.
- This aligns with a similar trend in $DOGE/$BTC between early 2017 and late 2021.
- If Shiba Inu mirrors the $DOGE/$BTC breakout in 2021, it could reach price levels beyond the current standing.
Shiba Inu Holds Key Support
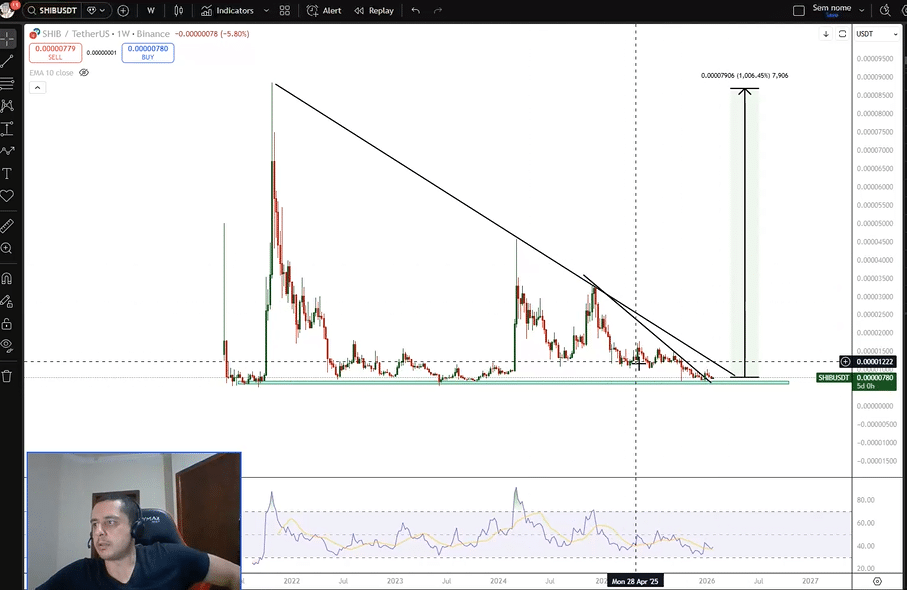
Analyst Guapeva highlighted this similarity in a recent TradingView projection. He identified that Shiba Inu has kept a key support area throughout its lifespan. Specifically, this demand zone lies around $0.0000068 to $0.0000061.
Shiba Inu retraced to this area following its May 2021 high and has since always returned there after each rally. For context, $SHIB rallied to $0.0000885 in October 2021, lost momentum there, and retraced to the support in June 2023.
After its March 2024 rally to $0.0000456 and another push to $0.0000334 after a brief consolidation, Shiba Inu also dropped to this area.
The analyst noted that this trend has persisted, with Shiba Inu also maintaining a descending triangle formation. An accompanying chart shows that the token has also broken out of a smaller downward trendline within the broader triangle, suggesting that a price rally is on the horizon.
Comparison With Dogecoin 2021 Price Action
Notably, the commentator compared this price action to that of Dogecoin in 2020. He highlighted a similar trend in $DOGE/$BTC between early 2017 and late 2021, when the pair also held support around 0.00000016.
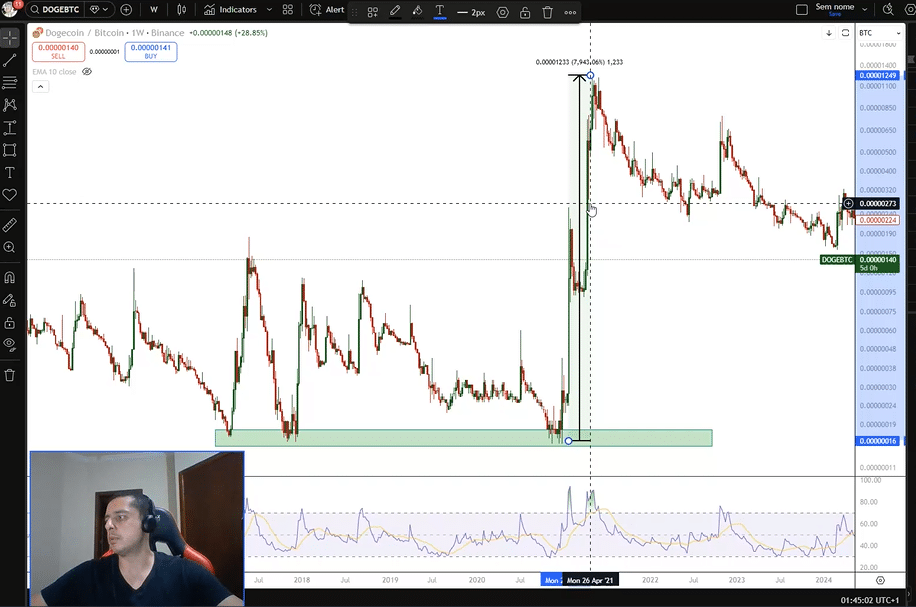
$DOGE/$BTC touched this support several times during this period before a breakout, resulting in an almost 8,000% surge. While the analyst does not expect the exact price rally, he sees Shiba Inu following a similar pattern.
Possible Shiba Inu Price Scenarios
If Shiba Inu mirrors this move, it could reach price levels beyond the current standing. According to the analyst, it could retest its 2021 peak of $0.0000885, representing an over 1,000% move.
However, before this level are key resistance zones that the token must surpass. Some of them are the March and December 2024 highs. There are also other macro supply zones, like the $0.0000176 resistance, that impeded further rallies in August 2022 and May 2025.
Notably, this outlook is purely based on technical analysis and is not in any way financial advice. There is also no certainty that it would happen.