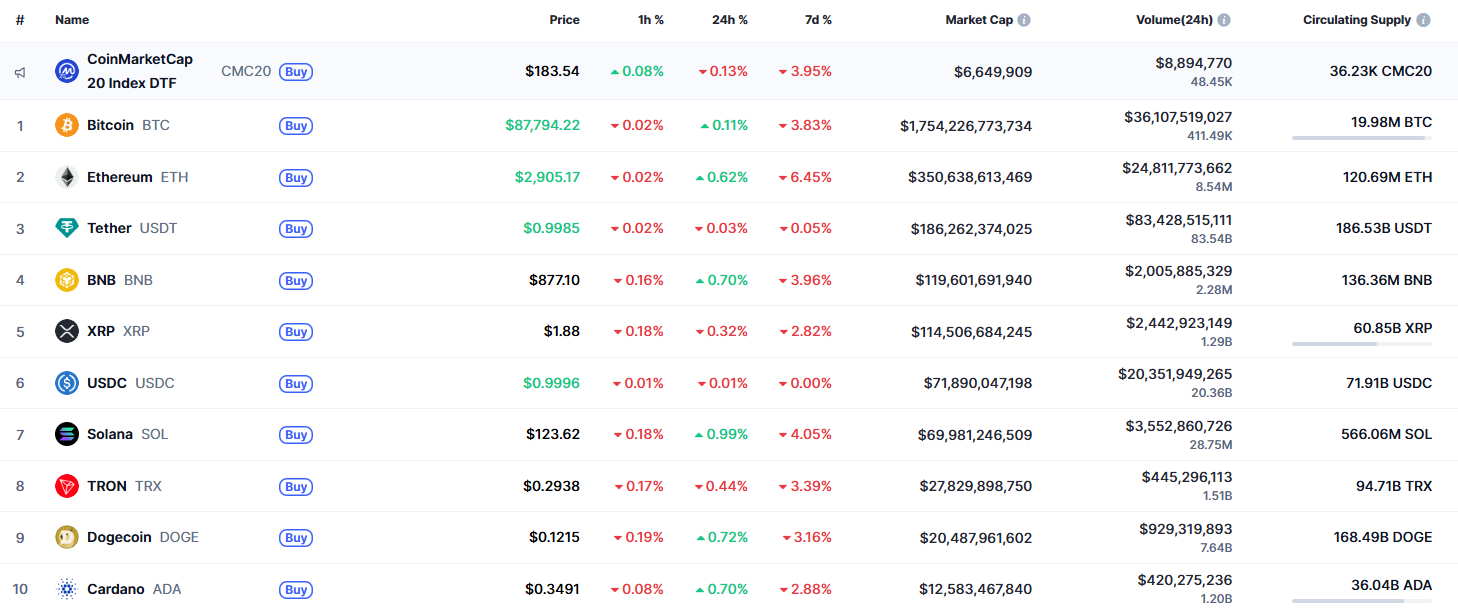
The market seems to be undecided as to which way to move, according to CoinMarketCap.
$SHIB/USD
The rate of $SHIB has fallen by 0.2% over the last day.
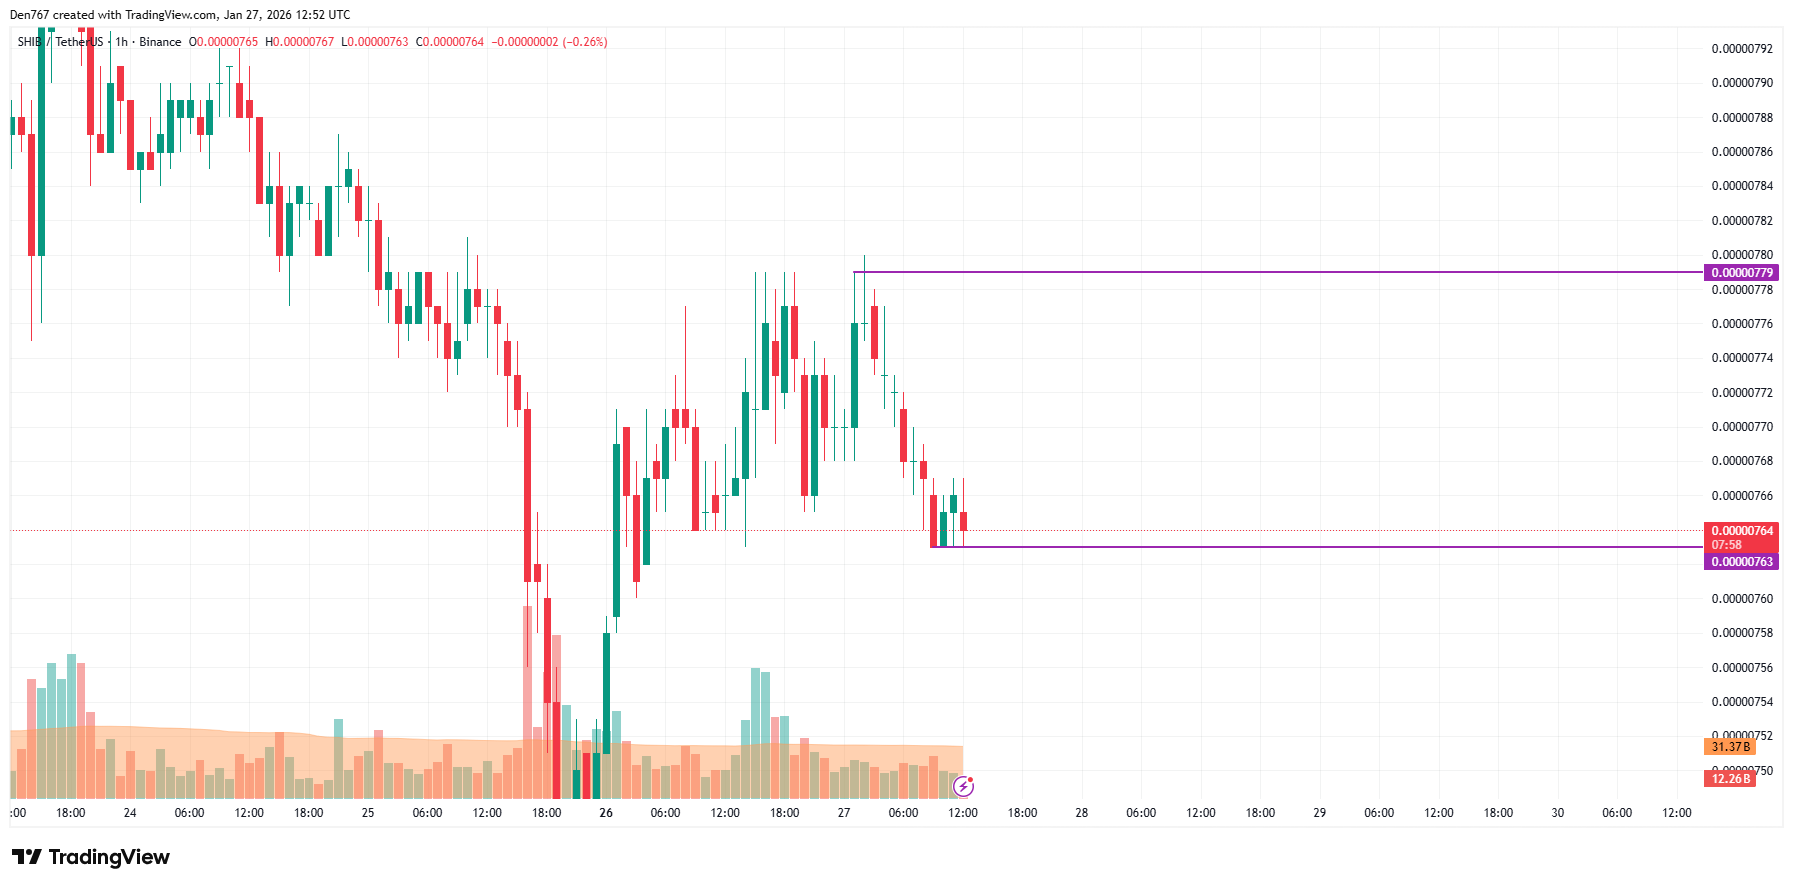
On the hourly chart, the price of $SHIB keeps looking bearish. If a breakout of the local support at $0.00000763 happens, the accumulated energy might be enough for a continued decline to the $0.00000750 range.
On the hourly chart, the rate of $SHIB has failed to keep rising after yesterday's bullish bar's closure.
If bears' pressure continues, one can expect a test of the nearest support level at $0.00000734. This scenario is relevant at least until the end of the week.
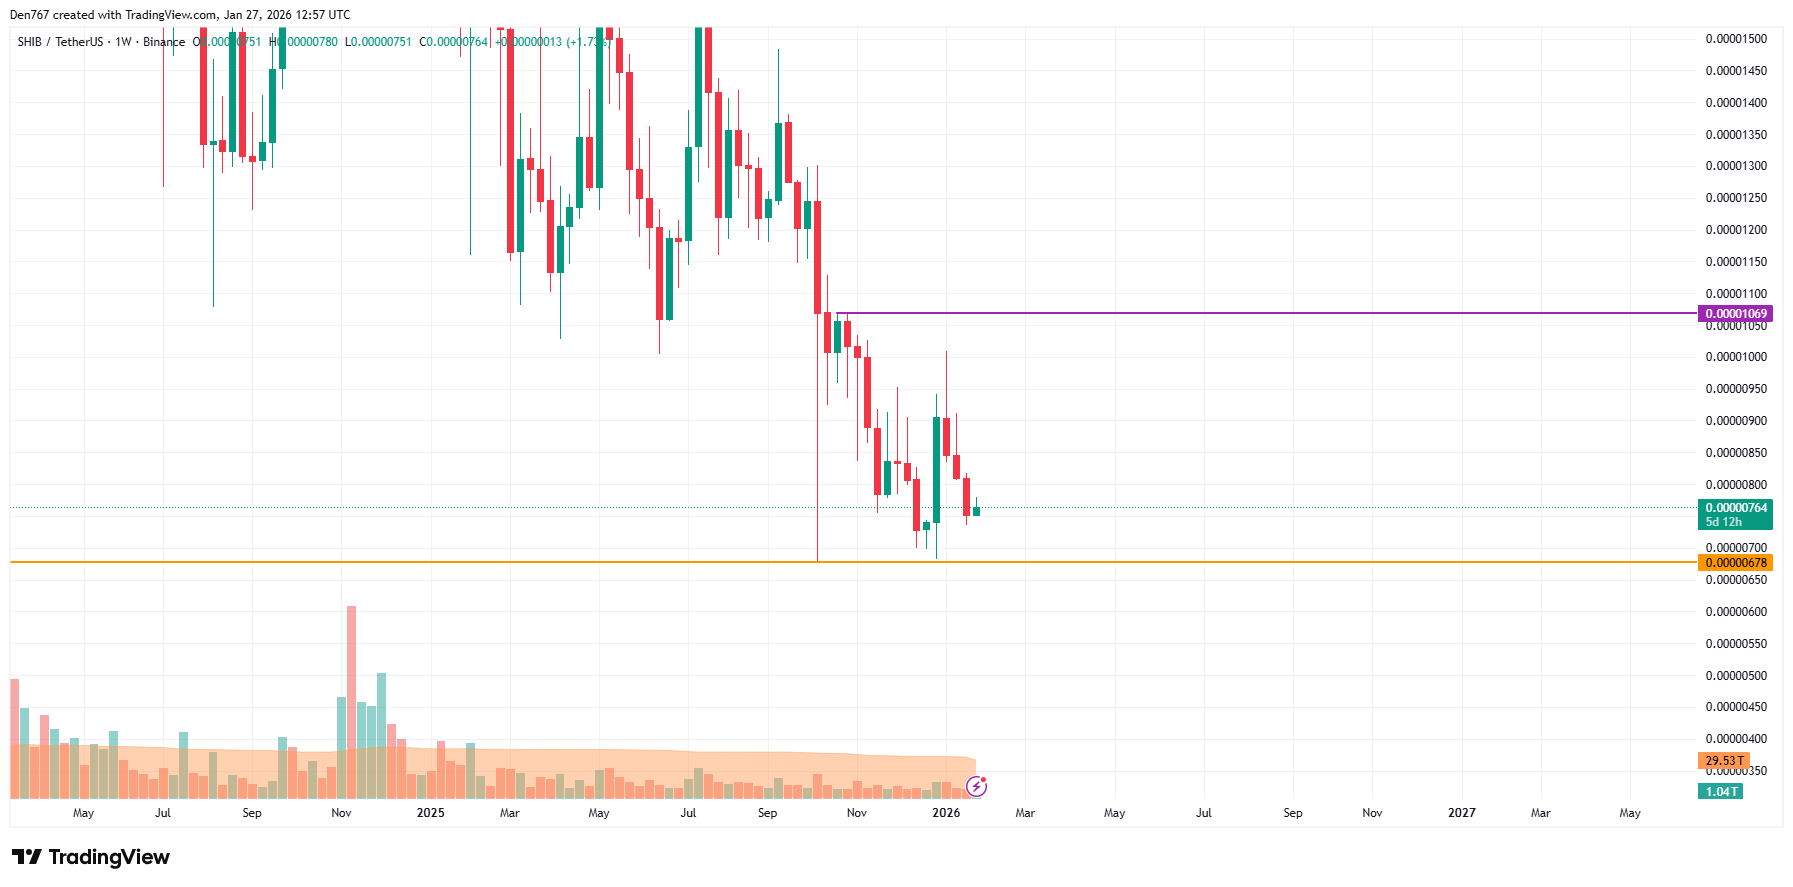
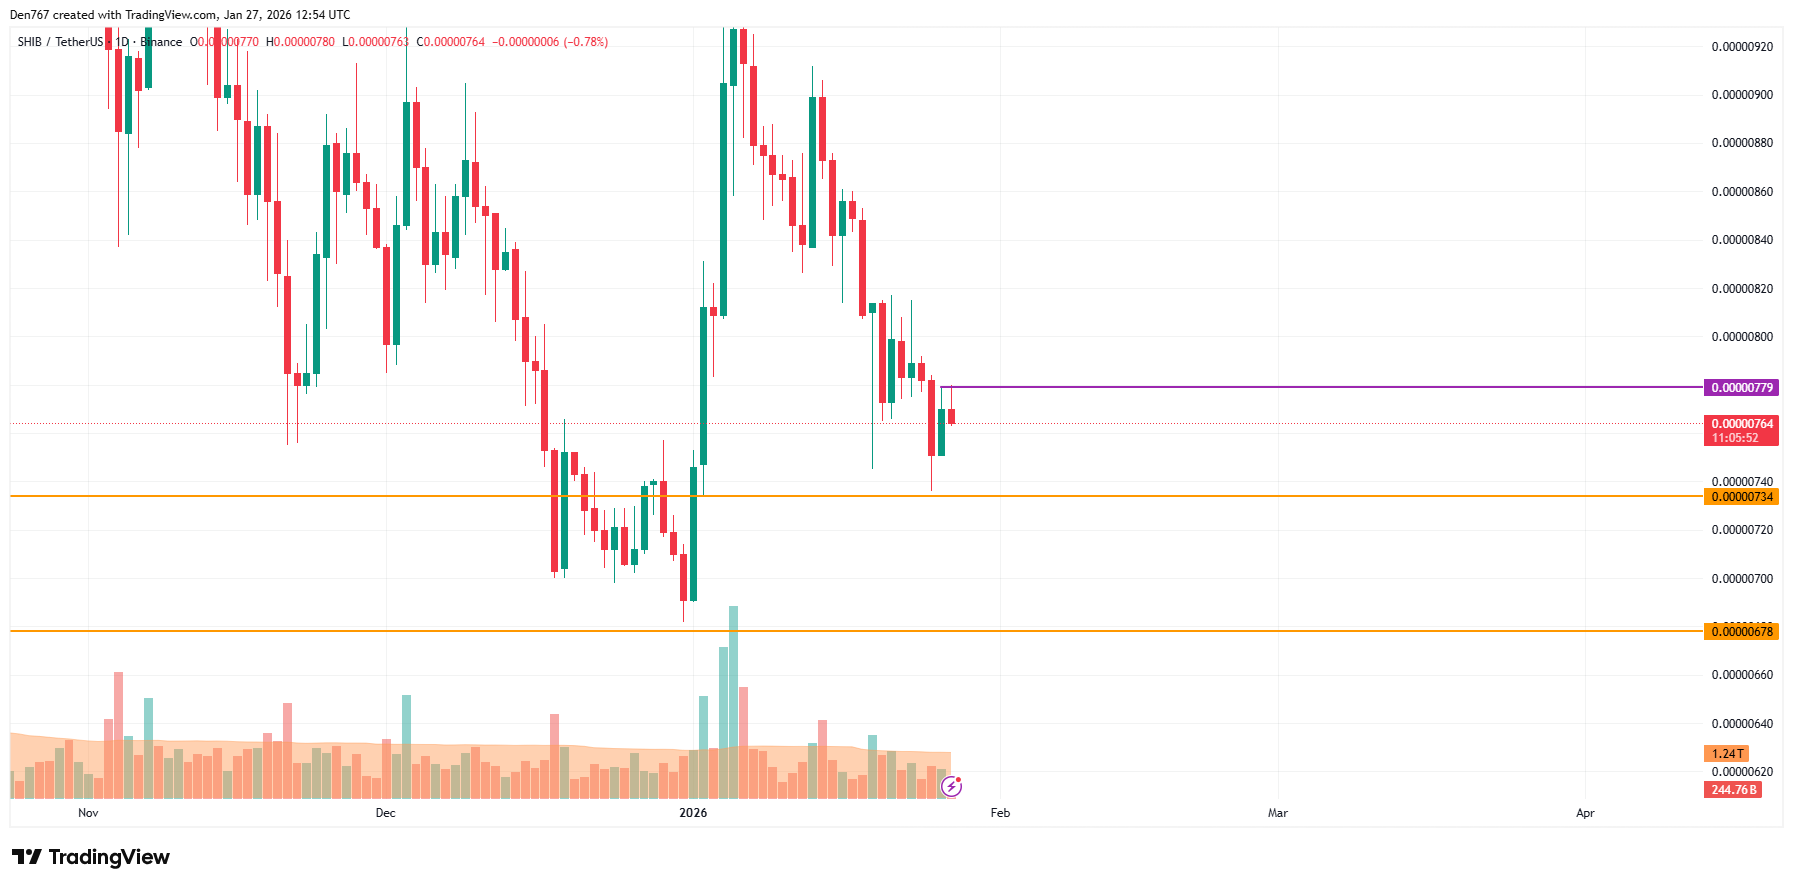
From the midterm point of view, there are no reversal signals yet. If the weekly candle closes below the previous bar's low at $0.00000736, traders may witness a further correction to the support at $0.00000678.
$SHIB is trading at $0.00000764 at press time.