Elsewhere, in terms of broader performance, Cardano is down about 4.1% over 7 days and 8.9% over 14 days. As the market watches Trump’s speech, any comments on crypto regulation or economic policy could further influence $ADA’s near-term outlook.
Cardano Price Analysis
On the weekly Cardano chart, the Fibonacci retracement levels give critical insight into the token’s potential support and resistance zones. Specifically, the price has tested and beaten the 1 Fibonacci extension around $0.51, with price action showing a bearish bias below this level.
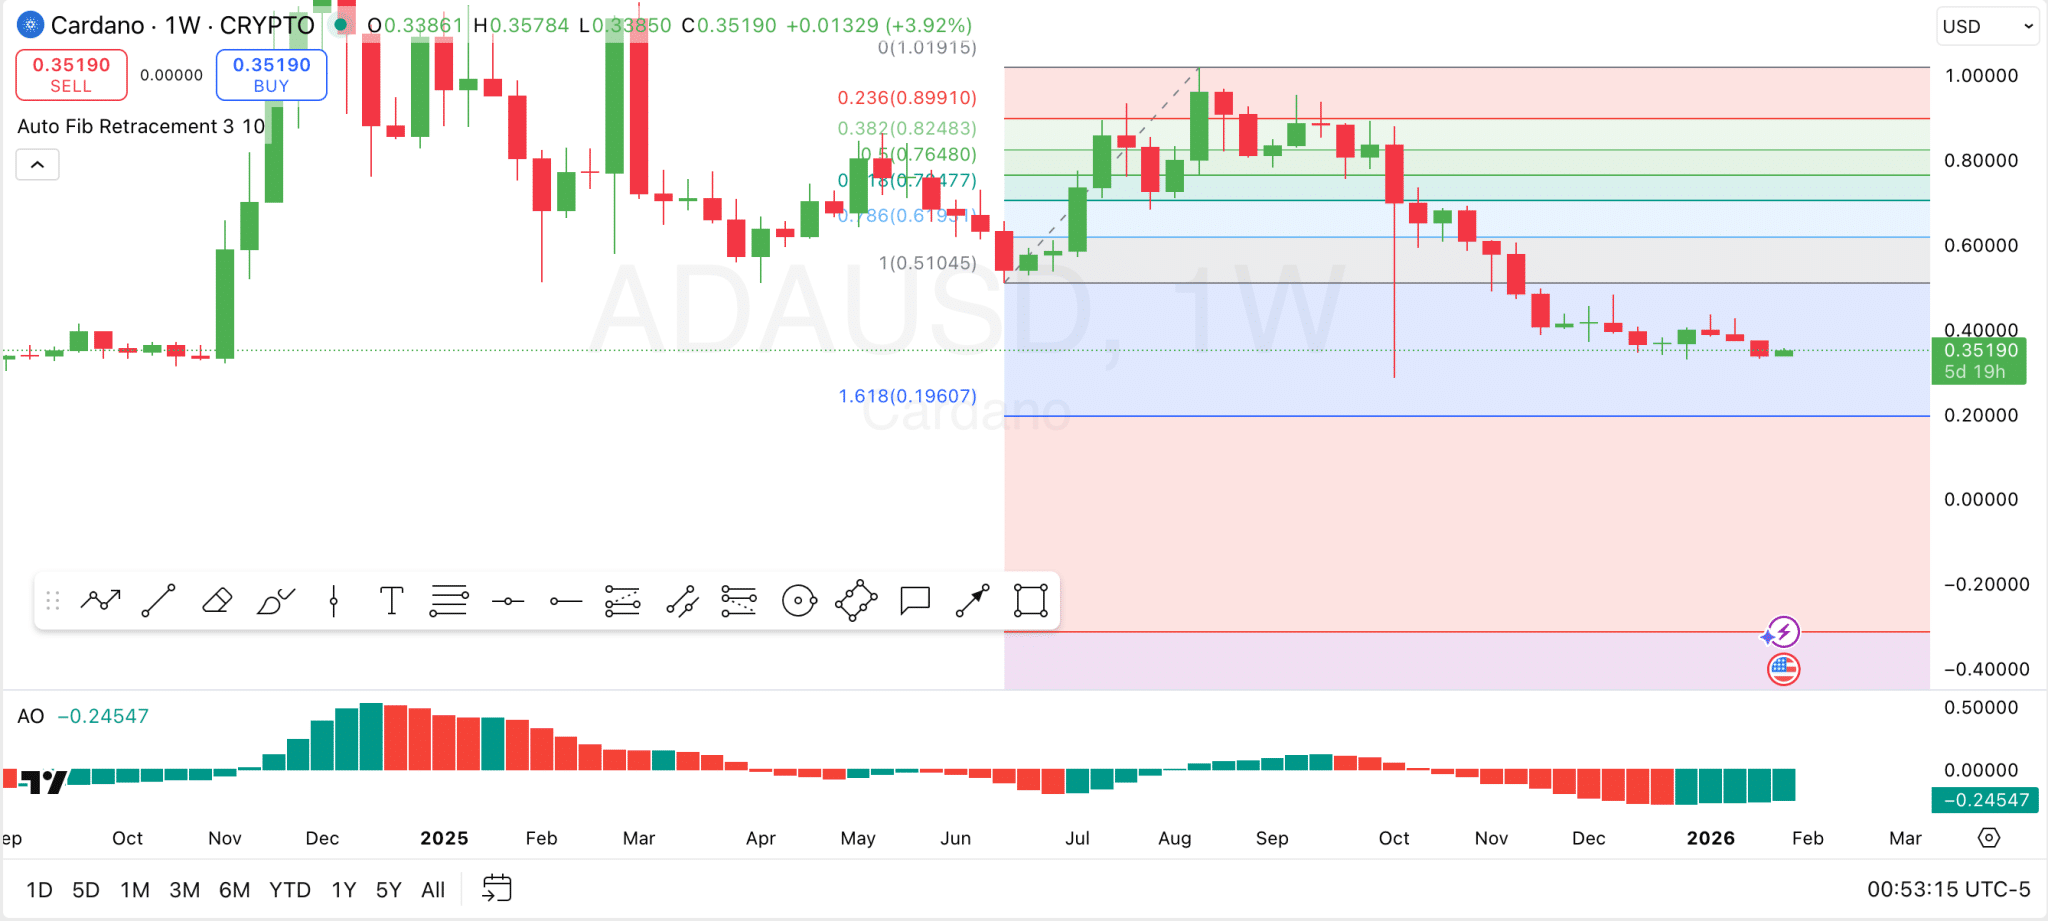
$ADA Weekly Chart
The retracement zones from the previous move (highs near $1.02 and lows near $0.5105) indicate that $0.6193 now remains a key resistance zone. If Cardano struggles to reclaim these levels, the price could continue to find support at lower levels, with $0.196 (the 1.618 level) being the next major target on the downside.
Momentum indicators also point to ongoing bearish albeit improving pressure. The Awesome Oscillator currently prints a negative reading of 0.245, indicating that momentum remains to the downside. For momentum to turn bullish, the histogram must maintain the green bars and surge to a positive reading. Additionally, the price must rise back above the 1 Fibonacci extension level to target higher zones.
Can Cardano Reach $1.3?
Notably, Rose Premium Signals on X highlighted that Cardano has confirmed a strong long-term support zone. The price is currently consolidating at a historical demand area showing clear accumulation behavior.
He noted that repeated reactions from this support zone increase the probability of a bullish reversal, and he’s watching for a continuation once momentum picks up. His price targets are $0.6386, $0.9358, and $1.3285, while maintaining that the risk remains controlled as long as the price stays above the confirmed support zone.

 thecryptobasic.com




