
Shiba Inu shows further signs of correction, as weak price momentum has led to the formation of a bearish continuation pattern.
The pattern becomes visible following $SHIB’s 5% drop yesterday, joining a broader market trend. Unless Shiba Inu regains momentum immediately, the bearish structure suggests a further price decline.
Key Points
- Shiba Inu shows deeper signs of correction, as weak price momentum has led to a bearish continuation pattern forming.
- The chart formation shows a bearish continuation pattern, with prices experiencing a sharp decline, a quick pullback to retest previous support levels, and a subsequent sideways trend targeting lower demand zones.
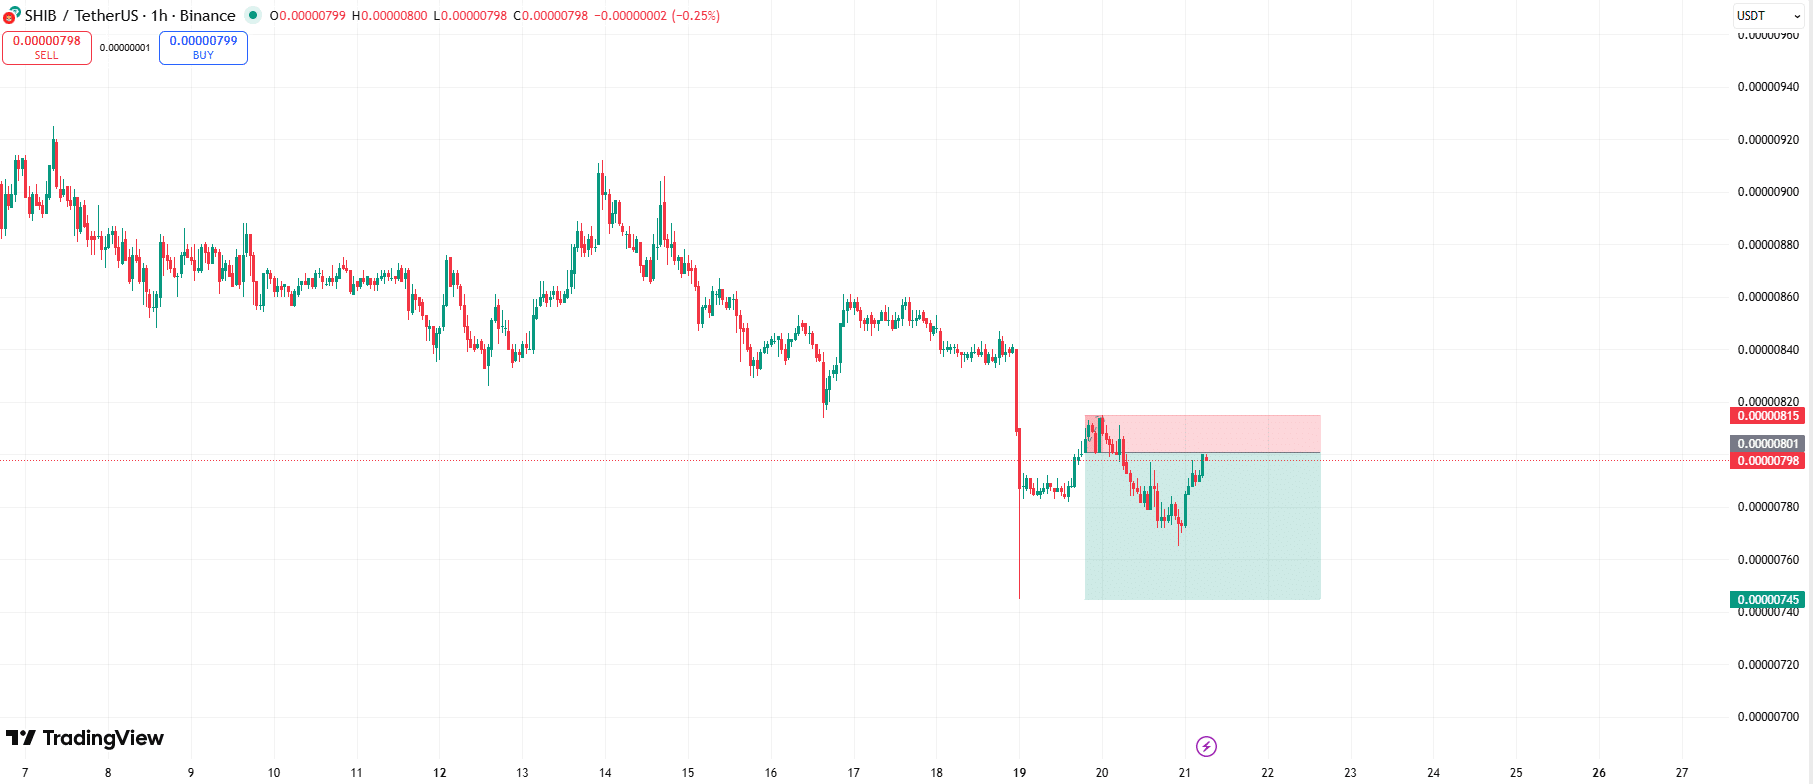
- Unless Shiba Inu regains momentum immediately, the bearish structure suggests a further price decline to January 19 lows around $0.00000745 and possibly its late December lows around $0.00000682
- Shiba Inu could invalidate the bearish continuation pattern if it breaks above the Tuesday high of $0.00000815.
Bearish Shiba Inu Structure
For perspective, Shiba Inu dropped to $0.00000745 on January 19, as the heat of Donald Trump’s tariff war impacted the crypto market extensively. However, the meme coin showed resilience, recovering nicely to close at $0.00000814.
Nonetheless, the 1-hour chart paints a cautious picture. The quick rebound pushed the token to a notable supply zone around the $0.0000081 price region. Higher price rejection followed a push to $0.000008115 on Tuesday, as weak price momentum failed to conquer the resistance around the area.
Since then, sellers have been on top, pushing prices lower. Moreover, the chart formation shows a bearish continuation pattern, with prices experiencing a sharp decline, a quick pullback to retest previous support levels, and a subsequent sideways trend targeting lower demand zones.
What Does This Mean for $SHIB Price
If Shiba Inu does not disrupt this structure, then it could retrace to lower prices. The chart shows a possible retest of its January 19 lows around $0.00000745. A much lower push could see the token consolidate to its late December lows around $0.00000682.
However, Shiba Inu could turn things around if it sustains ongoing recovery and breaks above the Tuesday high of $0.00000815. The move would invalidate the bearish continuation pattern and set $SHIB up for higher prices. The first area that $SHIB could reclaim in this scenario is the $0.0000084 level, where it started its January 19 correction.
It bears mentioning that these are likely scenarios based on technical analysis. The outlook does not favor one direction over the other, as both have equal chances of playing out. As a result, the choice of position is solely at your discretion, as this is not financial advice.