
A major Shiba Inu indicator has flashed bearish signals on the daily chart, piling more pressure on the price of the prominent meme coin.
The short-lived bullish rally in early January is losing momentum fast, and the key indicator further confirms this. Specifically, Shiba Inu has broken below the middle band of the Bollinger Band, a widely viewed bearish signal.
Key Points
- A major indicator has flashed bearish signals on the daily chart, piling more pressure on the price of the prominent meme coin Shiba Inu.
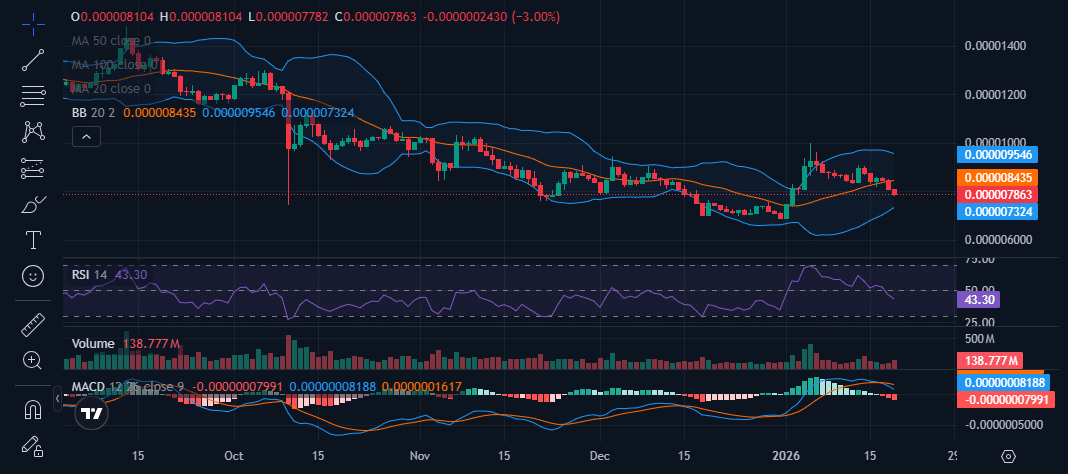
- Shiba Inu has broken below the middle band of the Bollinger Band, a widely viewed bearish signal.
- The sentiment around the Shiba Inu ecosystem swung to the bullish side following its ideal start to the year.
- However, rather than a bullish continuation, the top meme coin has lost steam, dropping below the middle band of the Bollinger indicator.
- The middle band is the 20-period simple moving average (SMA), an indicator that identifies short-term market trends.
- The next support if this weakness persists is the Bollinger Band’s lower band, which lies around the $0.0000073 price region.
Shiba Inu Bears Grow Stronger
The sentiment around the Shiba Inu ecosystem swung to the bullish side following its ideal start to the year. From January 1, the token ticked northwards, soaring 46% to its January 5 high of $0.00001009.
During this time, $SHIB broke above the upper Bollinger Band, signaling a strong uptrend. However, rather than a bullish continuation, the leading meme coin has lost steam amid a weak broader market trend.
Bears grew stronger, pushing the token down 22% from its January high to its current price of $0.0000078 per CoinMarketCap. This sideways trend has seen Shiba Inu drop below the middle band of the Bollinger indicator.
What Does This Mean for Shiba Inu
Notably, the middle band is the 20-day simple moving average (SMA), an indicator that identifies short-term market trends. $SHIB climbed above the indicator on January 2, contributing to its foray to the upper Bollinger Band.
As the bullish momentum stalled, it dropped 4.3% on Sunday, breaking below the mid-band. Losing this critical support point signals short-term bearishness and opens the door to a further downtrend.
Shiba Inu has continued to fall further away from the middle band, sustaining the trend shift. The next support if this weakness persists is the lower Bollinger Band, which lies around the $0.0000073 price region.
Key Caveat to Note
Meanwhile, losing the 20-day SMA does not put the final nail in Shiba Inu’s coffin, as bulls can still rally and drive a recovery. Again, the broader crypto market sentiment can change quickly, impacting the meme coin’s price.
Hence, this analysis provides exposure to current market reality, as reflected in technical indicators, and is not a prediction of Shiba Inu’s subsequent price action, nor is it financial advice.