Over the last hour, the price of $XRP clocked in at $2.14 to $2.17 on Jan. 14, 2026, flashing signs of resilience in a market still grappling with volatility. With a market capitalization of $130 billion and a 24-hour trading volume of $5.16 billion, $XRP stayed lively within a tight intraday price range of $2.08 to $2.18. Notably, $XRP/KRW trading volume surged, capturing nearly 13% of South Korea’s crypto market activity.
$XRP Chart Outlook
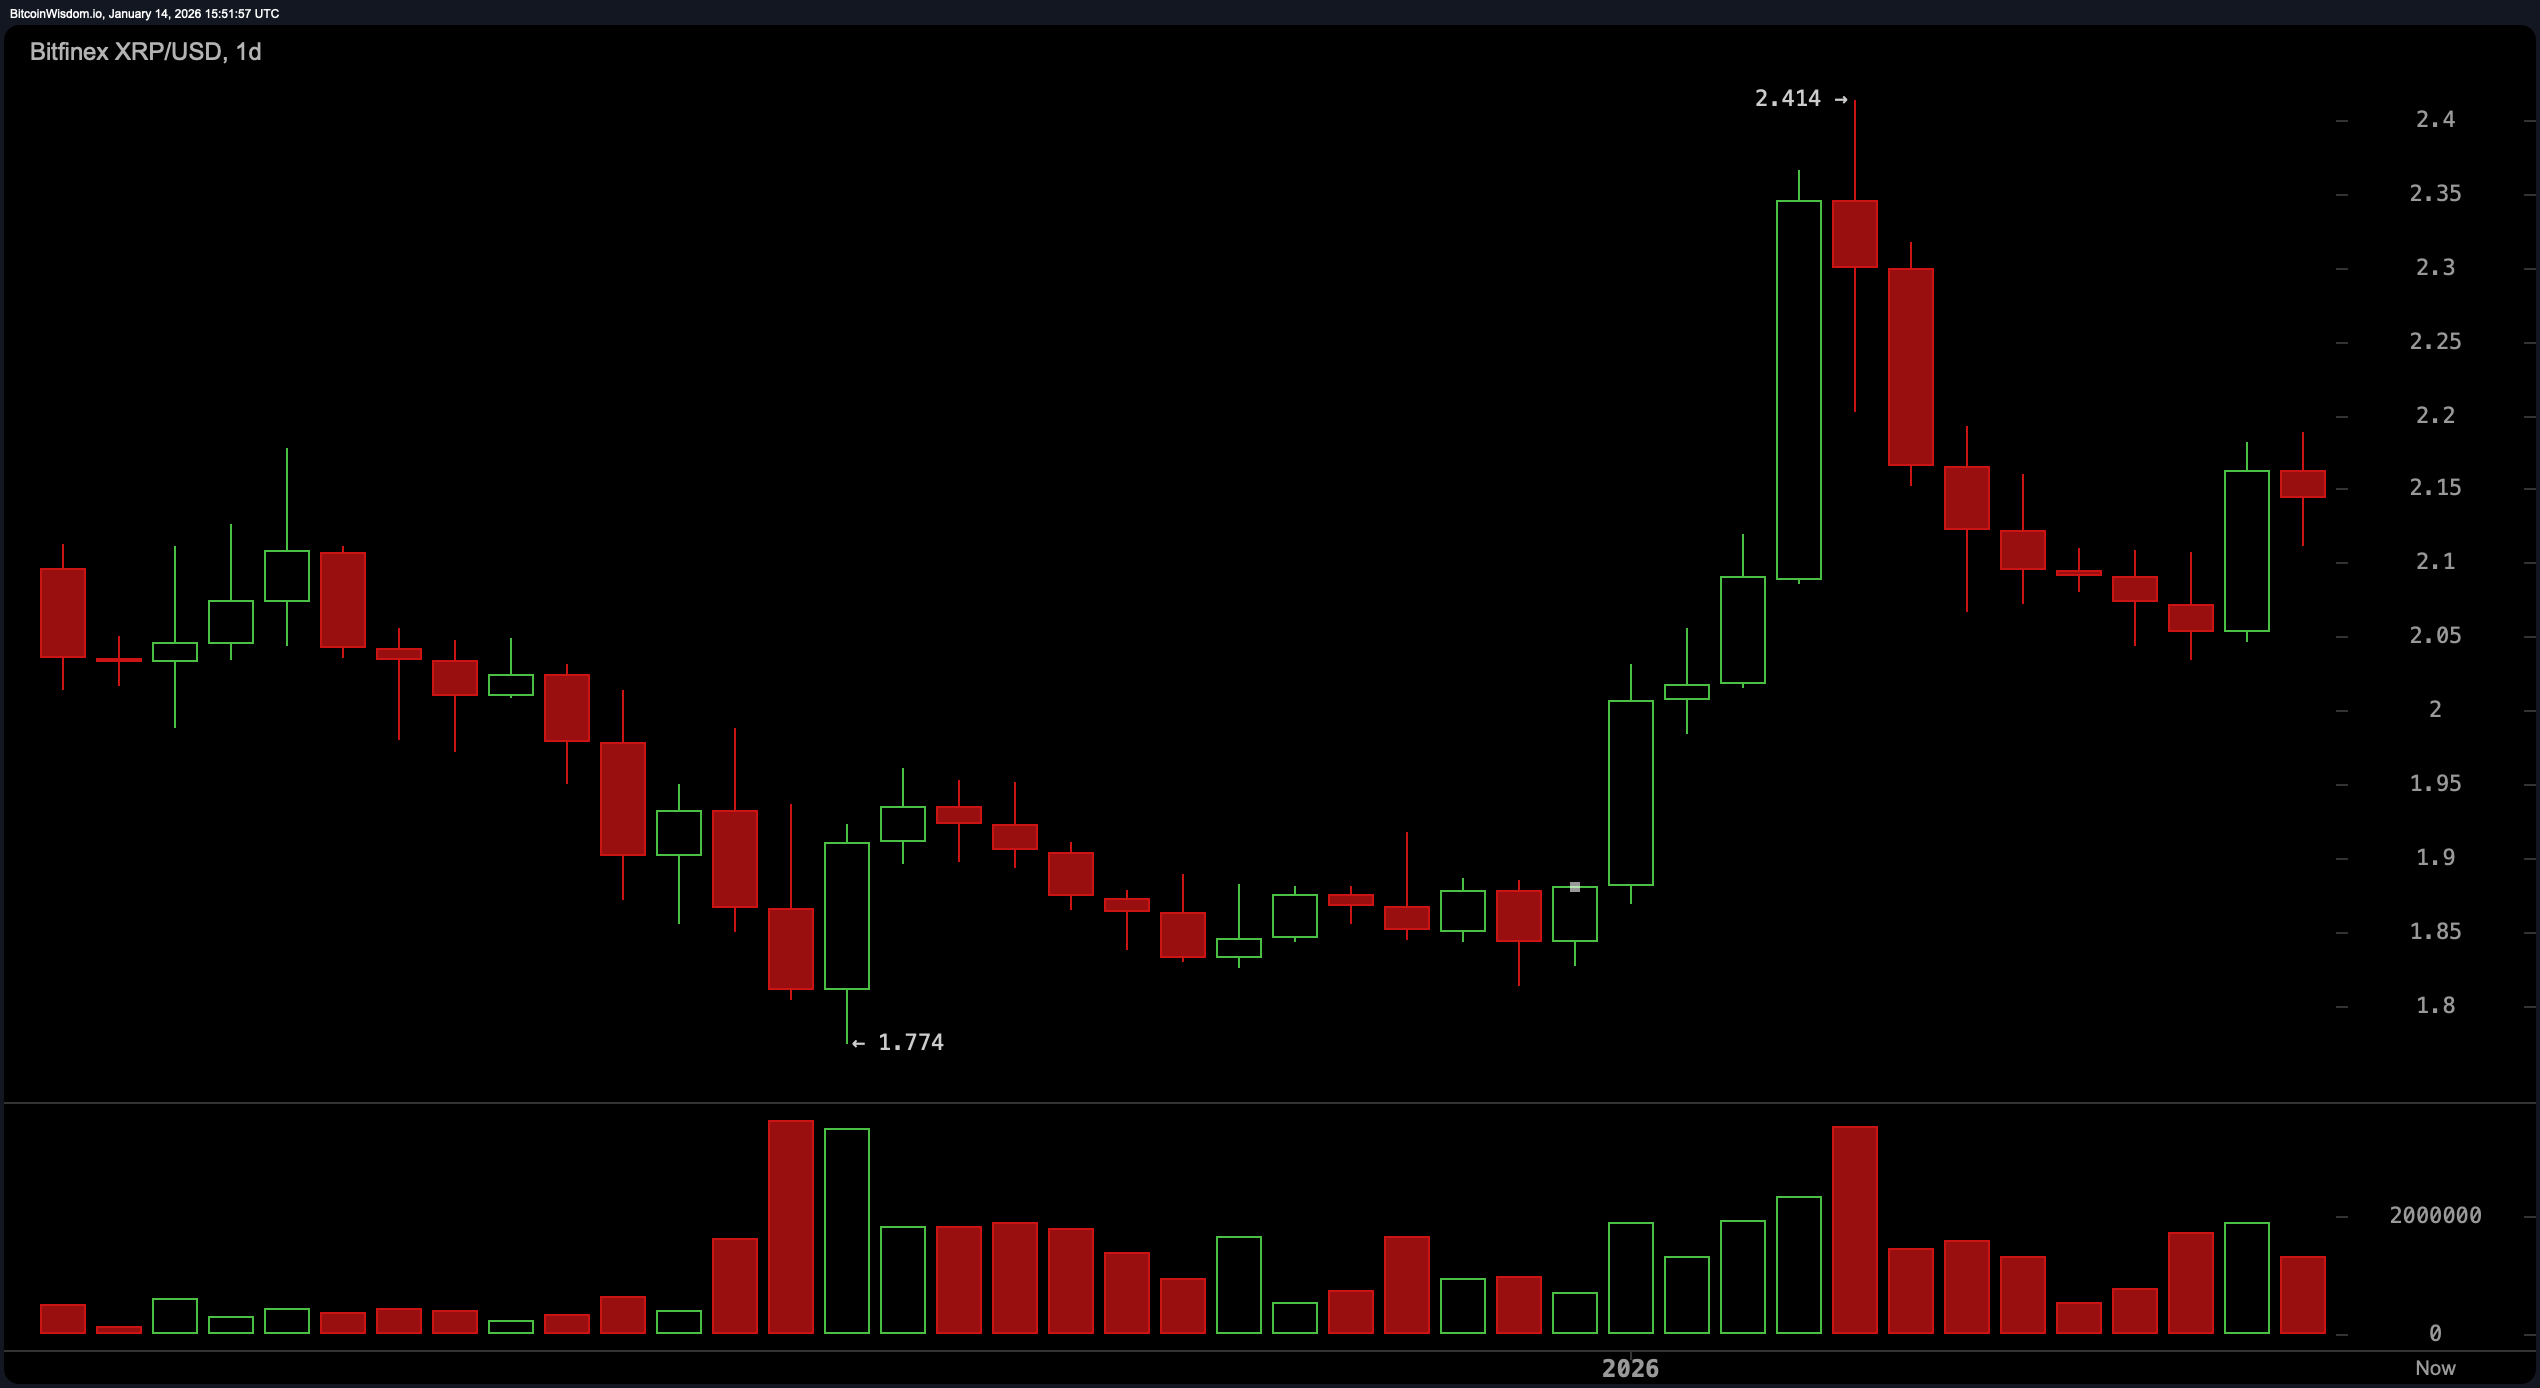
On the daily chart, $XRP continues to strut with a bit of swagger, bouncing off the $2.05 support like it owns the runway. That rebound came with an uptick in volume, suggesting that smart money might be slipping back into the scene after a modest correction from the $2.41 high.
Momentum remains cautiously optimistic as price action shifts toward a retest of $2.20, with the broader target eyeing the $2.35 to $2.41 resistance zone. Price-wise, we’re still inside the macro swing, but with the bulls itching to make a statement, all eyes are on volume for the next cue.
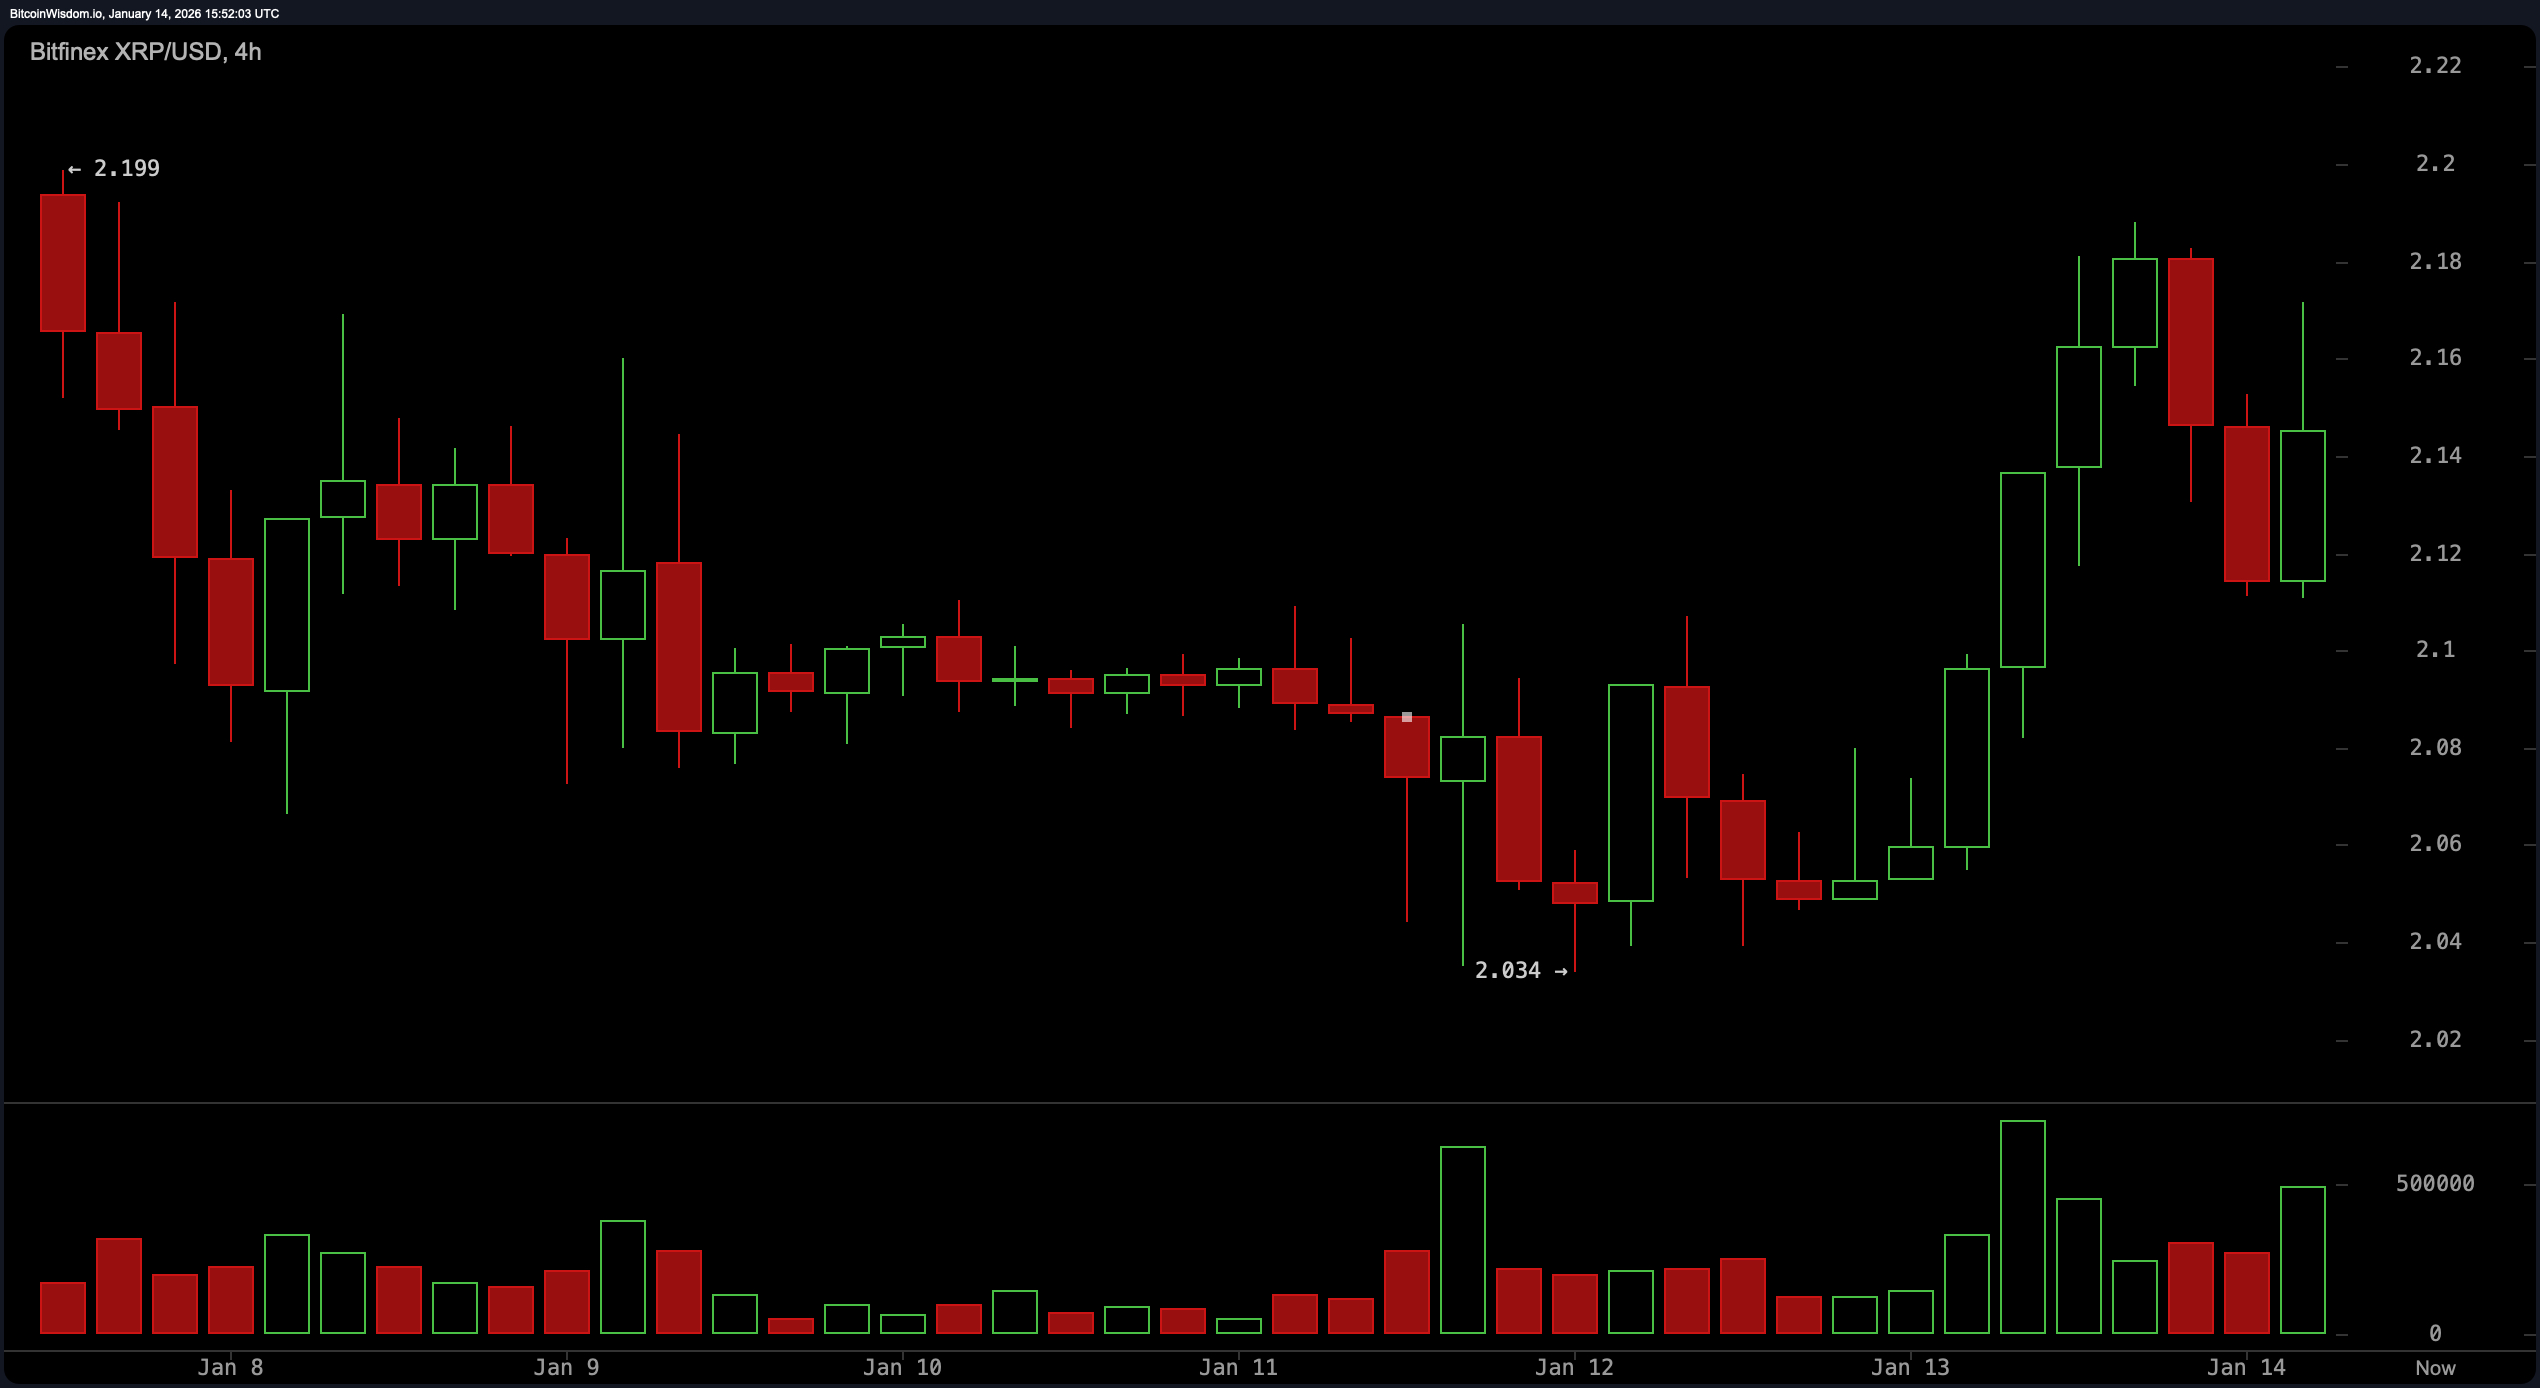
The four-hour chart presents a more intimate view of $XRP’s flirtation with short-term trend continuation. Following a rejection at $2.18, $XRP traced a rounded bottom—a textbook setup with increasing green candle volume that makes you raise an eyebrow in technical approval. With a volatility squeeze narrowing between $2.12 and $2.18, this pattern screams coiled potential. A push through $2.18 with conviction could usher in a test of $2.25, while dips toward $2.08 would spell drama, invalidating this pleasant bullish narrative. Let’s call it: tight stop-loss, wider aspirations.
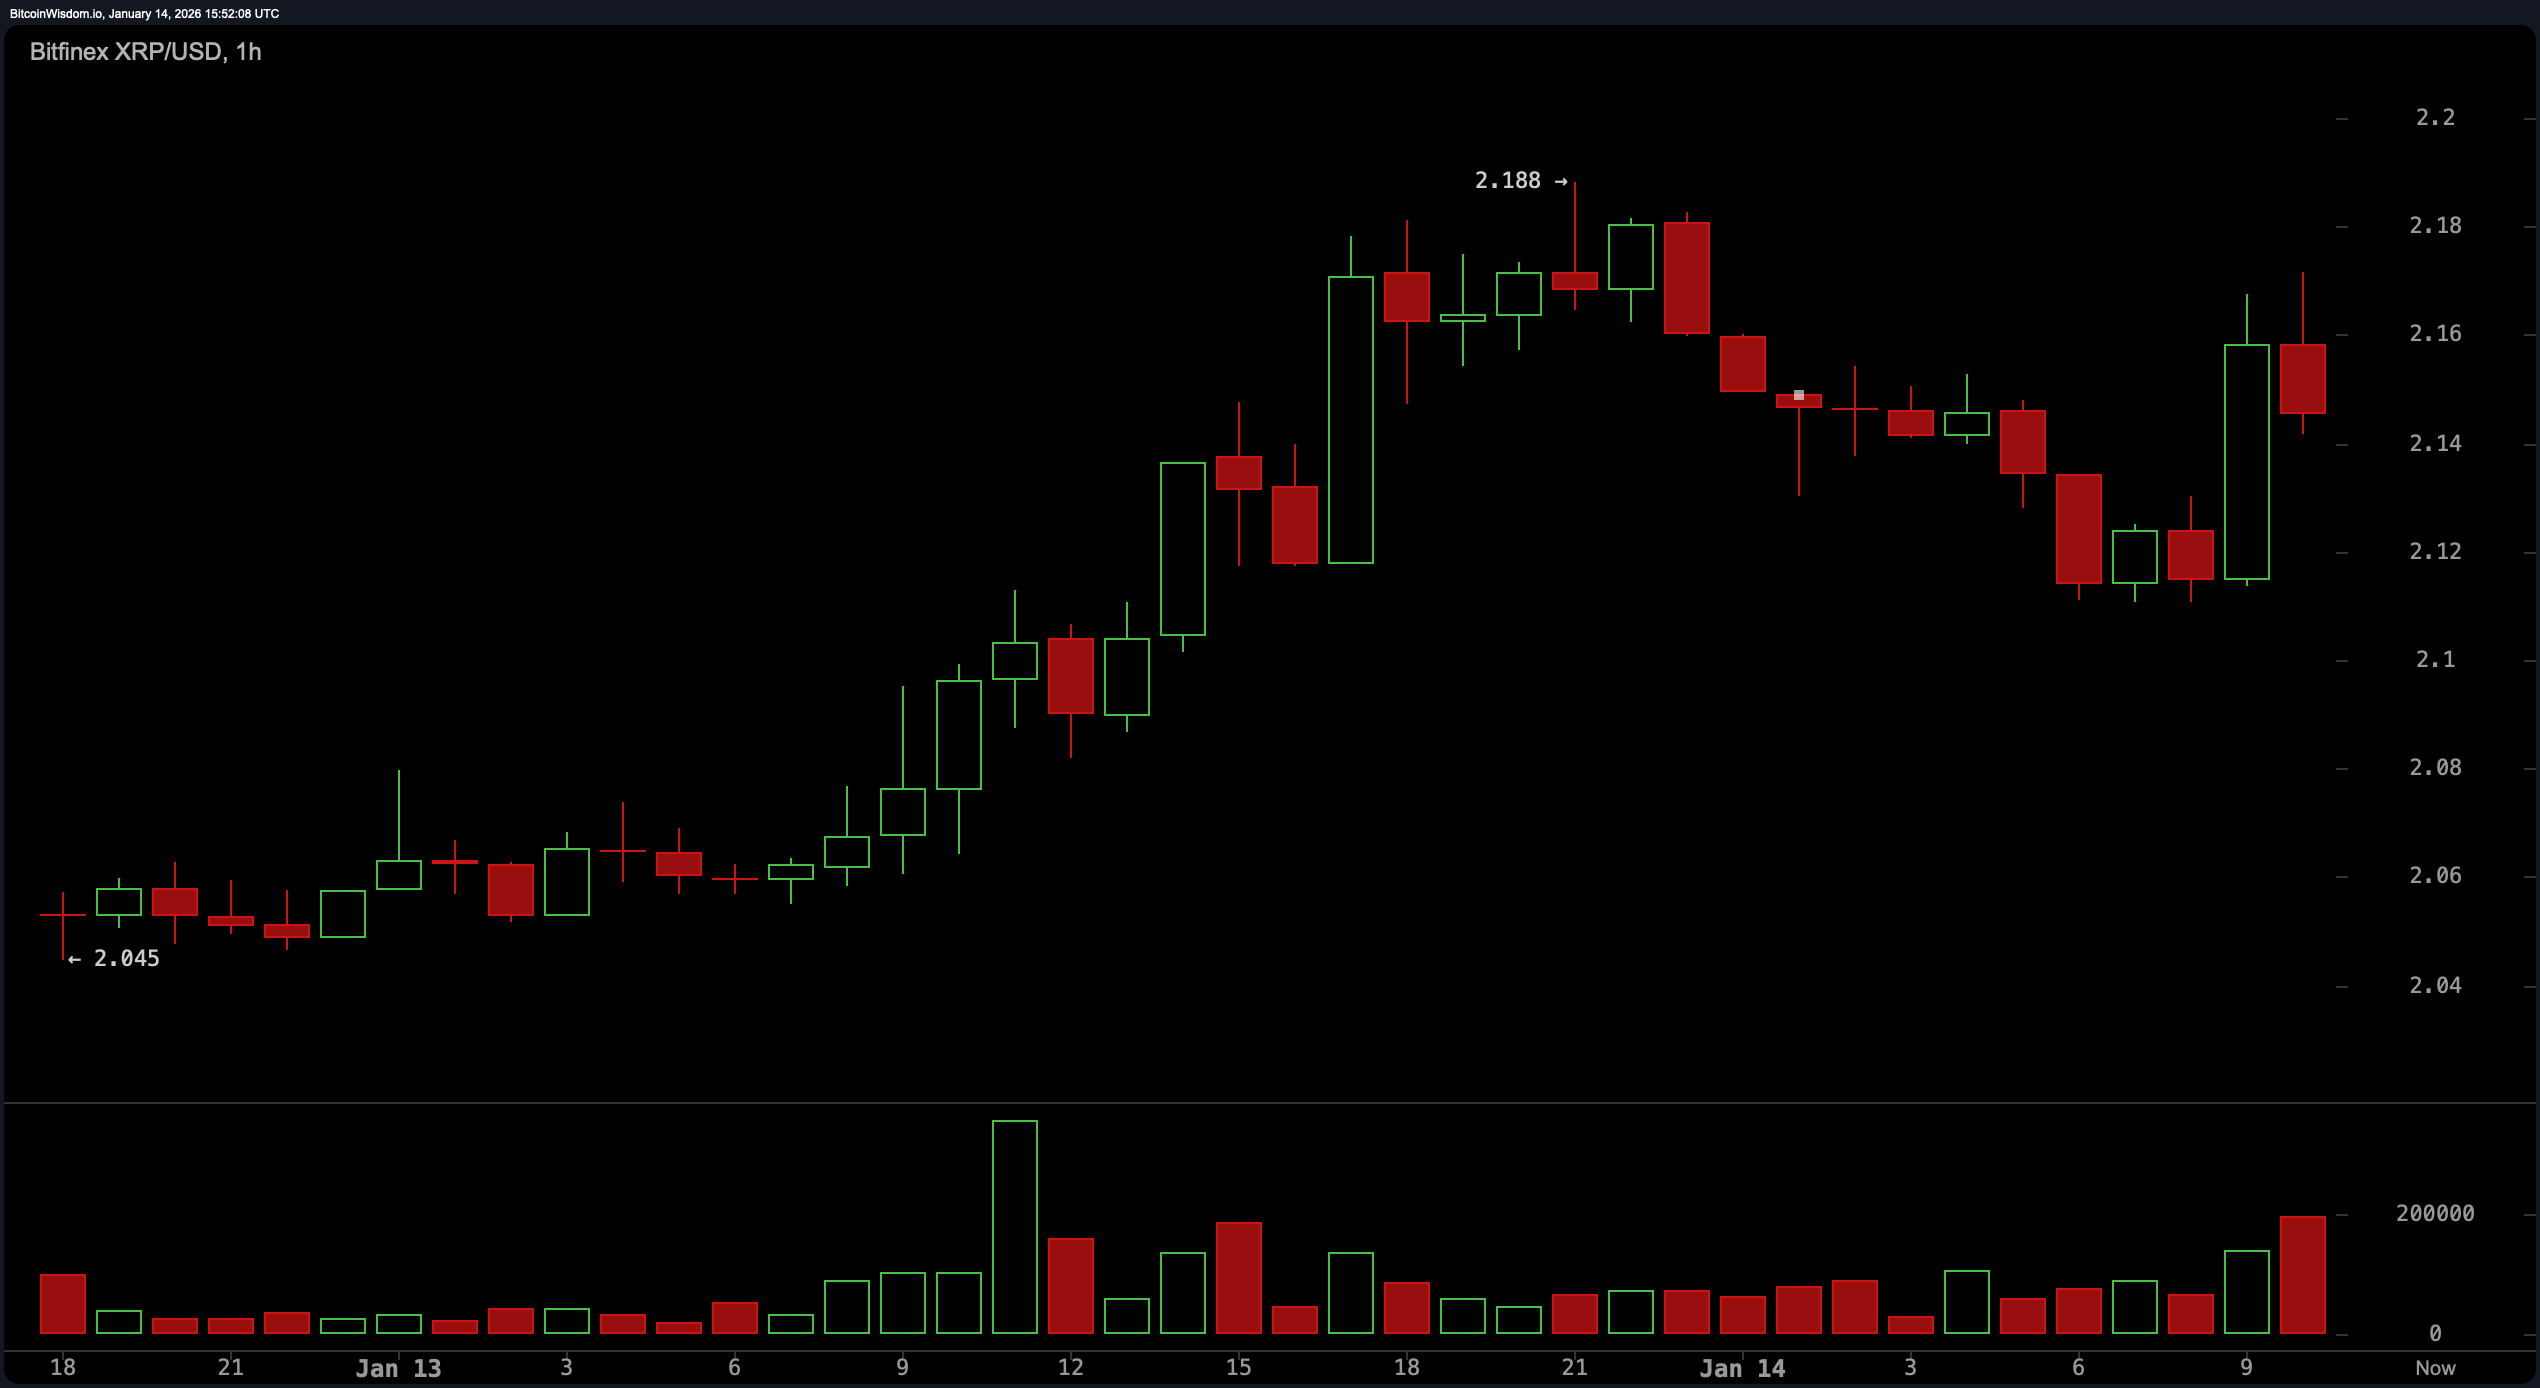
Down at the one-hour mark, $XRP is showing some short-term finesse. After bottoming out at $2.045, it staged a neat recovery to $2.188, dipped to $2.12, and then flexed a bullish engulfing candle to close the hour—because why not keep things interesting? The formation of higher highs and higher lows, coupled with rising volume on green candles, signals confidence among intraday traders. With ideal entry zones floating between $2.14 and $2.16, and scalpers sniffing opportunities toward $2.25, this timeframe is a microcosm of strategic poise with a sprinkle of FOMO.
Oscillators are playing coy, most clocking in with neutral readings. The relative strength index ( RSI) sits at 57.3, the Stochastic oscillator hovers around 51.2, and the commodity channel index (CCI) holds at 62.6—all shrugging their shoulders for now. The average directional index (ADX) at 29.4 shows trend strength but not dominance. Momentum indicator reads slightly bearish at 0.0612, while the moving average convergence divergence ( MACD) offers a subtle nudge toward bullish continuation at 0.0426. If these indicators had personalities, they’d be sipping tea and watching the market decide its next mood.
Moving averages (MAs) are throwing a mixed but intriguing party. The exponential moving averages (EMA) across 10, 20, 30, and 50 intervals are offering subtle support, with values ranging between $2.05 and $2.08—each nodding in technical approval. The simple moving average (SMA) on the 10-period, however, pulls a contrarian move at $2.15. Both the 100 and 200-period EMAs and SMAs flash bearish divergence, suggesting the long-term trend hasn’t entirely shaken off the past. It’s a classic case of short-term optimism versus long-term hesitation—a tale as old as technical analysis.
Bull Verdict:
$XRP is flexing short-term strength across the 1-hour and 4-hour charts, supported by rising volume and a structure of higher lows. With multiple exponential moving averages (EMA) aligning beneath the current price and the moving average convergence divergence ( MACD) signaling upward momentum, a breakout above $2.18 could open the gate toward retesting the $2.35 to $2.41 range. For now, the bulls are steering—if only slightly—with the wind at their backs.
Bear Verdict:
Despite the short-term flirtation with upside, the longer-term moving averages, particularly the 100 and 200-period simple and exponential moving averages, paint a picture of overhead resistance and caution. Oscillators remain largely noncommittal, with momentum leaning soft. Unless $XRP can command a breakout above $2.18 with solid volume, this may all be just noise before a return to the $2.05 support or lower.
FAQ ❓
- What is the current price of $XRP? $XRP is trading at $2.14 to $2.17 as of Jan. 14, 2026, at 11 a.m. Eastern time.
- What price levels should traders watch?Key support sits at $2.05, with resistance near $2.18 and $2.41.
- Is $XRP showing bullish or bearish signals?Short-term charts lean bullish, but long-term averages remain cautious.
- Where is $XRP trading the most? $XRP/KRW leads with millions in volume, dominating Korea’s market share.