The Solana price faces critical resistance at the upper Bollinger Band, with a breakout needed for continued bullish momentum or risk consolidation.
Solana ($SOL) has shown a notable price increase over the past 24 hours, trading at $144 amid a 2.9% rise within this period. The asset spiked to $147.08, testing key resistance levels. However, $SOL has yet to break past the $147 resistance, which will be crucial for further bullish movement.
Compared to Bitcoin, Solana has performed well in the last 24 hours, with BTC showing a 0.3% decline. Over the past 7 days, Solana has recorded a 4.1% increase, while the 14-day performance shows a 15% increase. Solana’s ability to sustain this momentum will depend on breaking key resistance levels and broader market conditions.
Solana Price Prediction
The 4-hour TradingView chart indicates that Solana recently faced rejection at the upper Bollinger Band near $146.5, which suggests that the current bullish momentum may be losing steam unless a breakout occurs. Moreover, the Bollinger Bands indicate that the market is experiencing increased volatility, and the rejection at the upper band signals potential resistance.
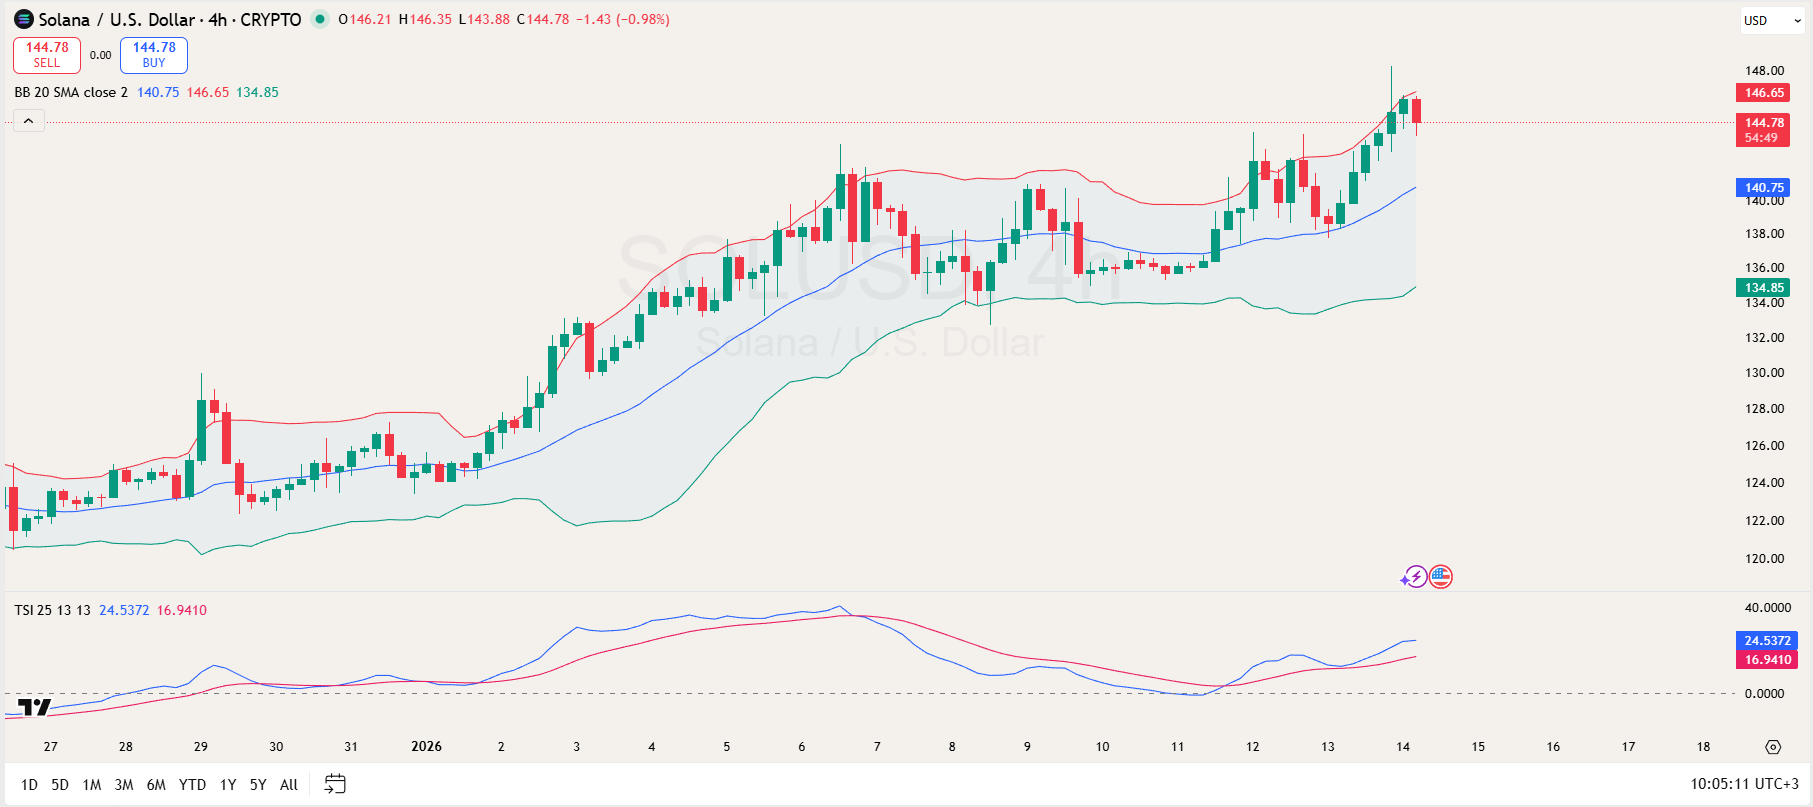
Additionally, the True Strength Index is currently at 24.54, showing positive momentum, while the signal line rests at 16.94, indicating that the momentum is still strong but not yet fully overbought. For Solana to maintain its bullish trend and continue its upward movement, it will need to break above the $146.5 resistance level.
If the price manages to clear this barrier, it could set up a potential rally towards levels like $148.2, whereas failure to break this resistance may lead to consolidation or even a pullback to lower levels like $140 or $134.
Solana Case Scenarios
Elsewhere, an analyst UB from X highlights a significant resistance level for Solana, which has been tested multiple times over the past two months. This level, seen near $141.17, has proven to be crucial, with the price only breaking it once. UB suggests that this price point can serve as a foundation for both long and short setups, depending on how the market reacts.

A break above this level could trigger a bullish breakout, offering a long setup for traders. However, if the price fails to hold above and instead reclaims the level after a brief deviation, it could signal a short setup.