
Dogecoin price held steady above a crucial support level, with the Elliot Wave pattern pointing to an eventual rebound in the near term.
- Dogecoin price has bottomed at a key support level.
- An Elliot Wave analysis suggests that the coin may rebound.
- $DOGE ETF inflows have jumped in the past few days.
Dogecoin ($DOGE) token was trading at $0.1397 on Saturday, a few points above the key support level at $0.1153. It remains in a bear market after falling by over 70% below its highest point in 2025.
A potential catalyst for the $DOGE token is that demand for its ETFs has jumped modestly. Data shows that the funds added over $1.94 million this week after adding over $2.59 million a week earlier. Their monthly inflows have jumped to $4.23 million, the biggest monthly increase ever.
These funds have added over $4.64 million in inflow, bringing the net assets to over $10.16 million. They account for 0.04% of Dogecoin’s market capitalization.
Dogecoin price Elliot Wave analysis
The weekly timeframe chart shows that the $DOGE price has slumped in the past few months, moving from a high of $0.4788 in November 2024 to the current $0.14.
A closer look shows that the coin remains slightly above the lower side of the megaphone pattern. A megaphone is one of the most common bullish continuation signs in technical analysis. Dogecoin has always rebounded whenever it moved to that support level.
At the same time, Elliot Wave analysis suggests that the coin has more upside in the coming weeks. It has already completed forming the AB, BC, and CD phases, and is now starting to form the DE phase.
If this happens, the initial target to watch will be at $0.3068, its highest point in September. Such a move would be a 117% above the current level. Flipping that resistance will move to the key resistance at $0.4788, up by 235% above the current level.
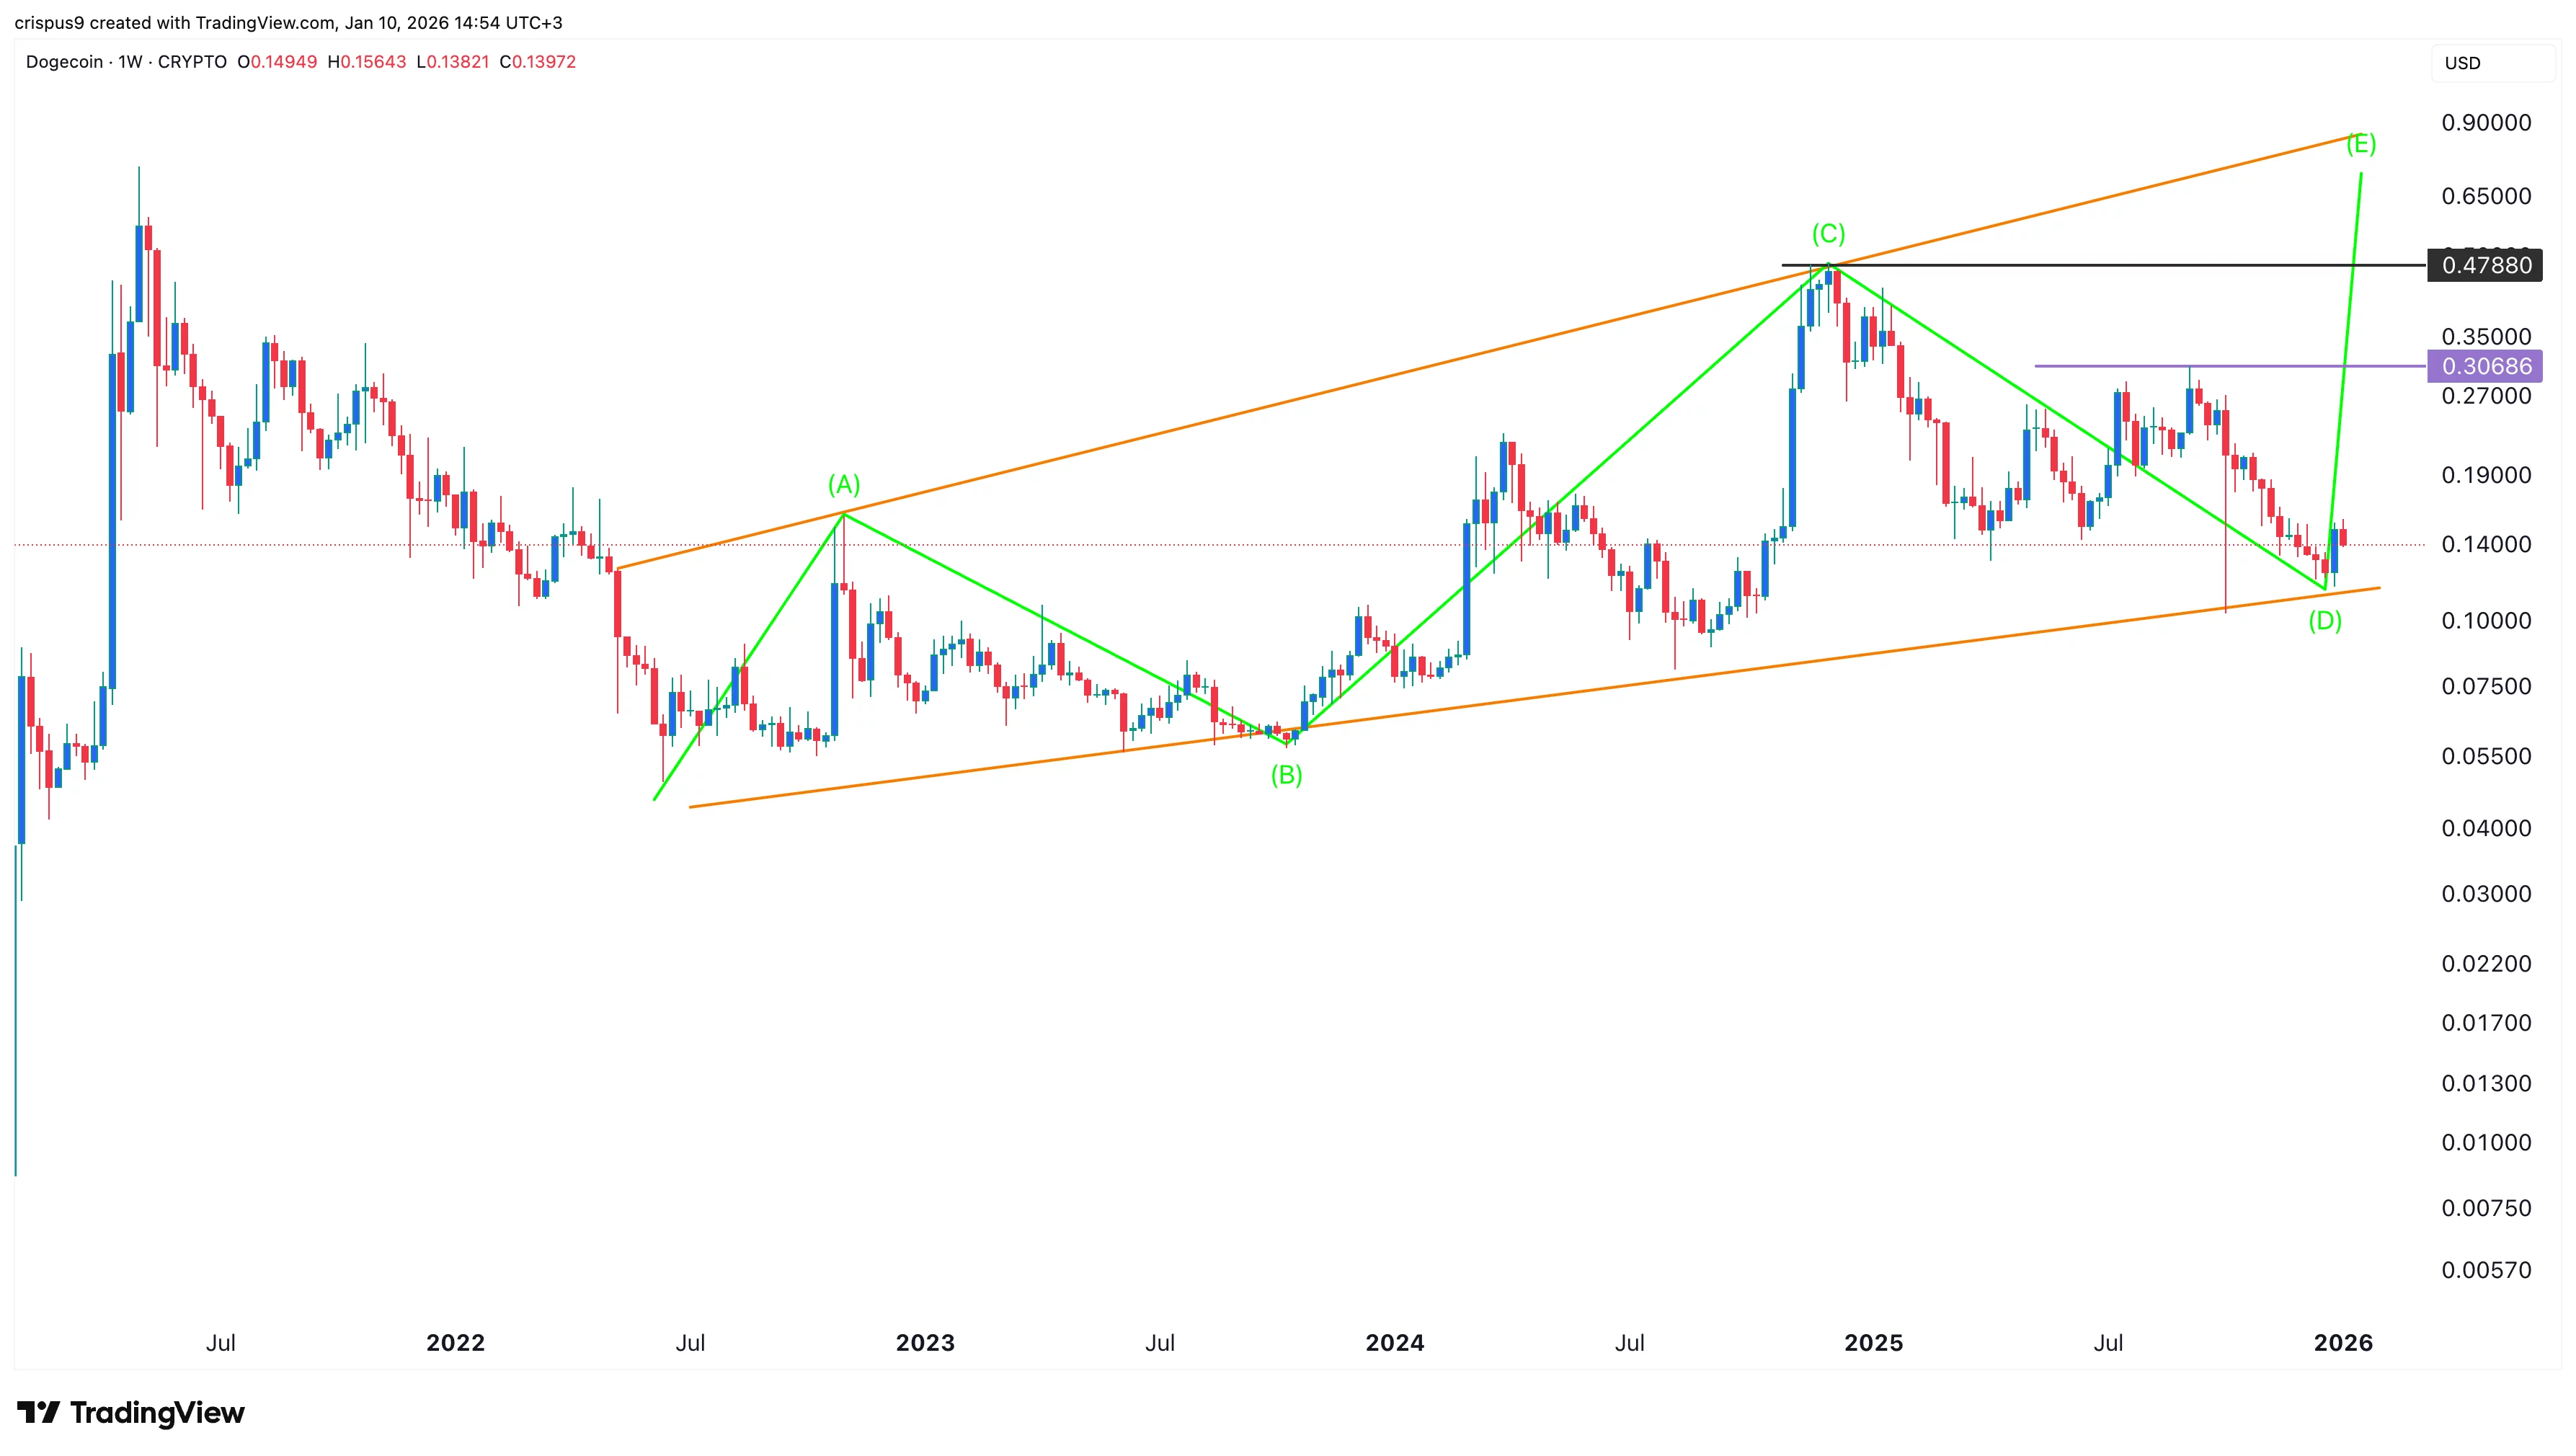
However, a move below the lower side of the channel will point to more downside as it will invalidate the Elliot Wave pattern. Also, the bullish $DOGE price will take time to unfold as it is based on the weekly chart.