
Algorand’s price has declined towards the $0.13 level after rejecting the $0.146 resistance level on Wednesday.
The bearish performance comes as Bitcoin, Ether, XRP, and other major cryptocurrencies are undergoing a correction.
Despite the correction, bullish sentiment could see $ALGO’s price rally higher in the near term.
The technical outlook suggests that $ALGO could hit the $0.15 level in the near term.
$ALGO slips below $0.14 despite bullish on-chain and derivatives data
Copy link to section
$ALGO, the native coin of the Algorand blockchain, has lost 5.3% of its value in the last 24 hours and is now trading at $0.1314 per coin.
The bearish performance comes despite bullish on-chain data.
According to DeFiLlama, Algorand’s Total Value Locked (TVL) has been steadily rising since mid-December and currently stands at $52.95 million.
The increase in TVL over the past few weeks indicates growing activity and interest in Algorand’s ecosystem.
This suggests that more users are depositing or using assets on $ALGO-based protocols.
Furthermore, CryptoQuant’s summary data also supports the positive outlook.
According to the summary data, $ALGO’s spot and futures markets show large whale orders and buy dominance, suggesting that a potential rally could be on the line.
On the derivatives side, Algorand’s funding rate has flipped positive, supporting a bullish bias.
Coinglass’s OI-Weighted Funding Rate data reveals that long traders currently outweigh short traders in the market.
The metric flipped positive earlier this week and now reads 0.0084%, supporting the current bullish outlook.
In the past, when funding rates switched positive, Algorand’s price experienced a sharp increase.
$ALGO could surge to $0.15 despite market correction
Copy link to section
The $ALGO/USD 4-hour chart is bearish and efficient as Algorand has lost 5% of its value in the last 24 hours.
$ALGO’s price broke above the falling wedge pattern on Sunday but has added nearly 15% to its value since then.
However, it failed to top the $0.146 resistance and is now trading at $0.1314 per coin.
With the $0.133 support level and 50-day Exponential Moving Average (EMA) failing, $ALGO’s price could experience further selling pressure and retest the $0.1241 zone.
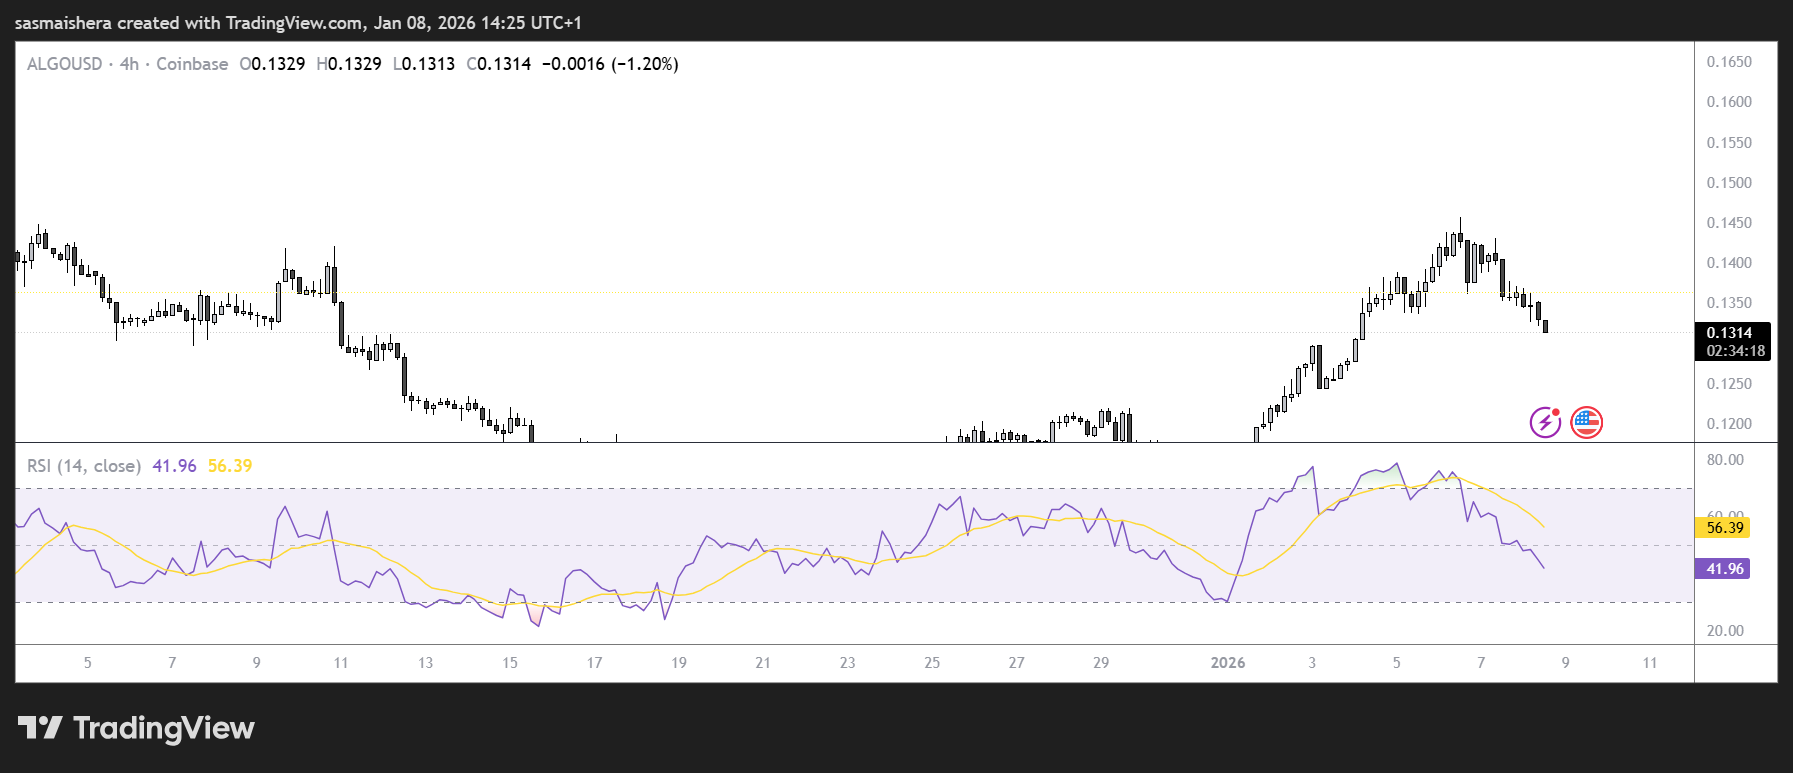
The Relative Strength Index (RSI) on the 4-hour chart reads 56, above the neutral level of 50, indicating bullish momentum is gaining traction.
Furthermore, the Moving Average Convergence Divergence (MACD) indicator shows a bullish crossover and rising green histogram bars above the neutral level.
If the momentum indicators continue with the bullish scenario, $ALGO could extend the rally toward the next daily resistance at $0.152.
An extended bullish run and a close above this level would allow $ALGO to extend gains toward the next key resistance at $0.186.
Currently, the market conditions are volatile, with no clear direction from the traders.