u.today

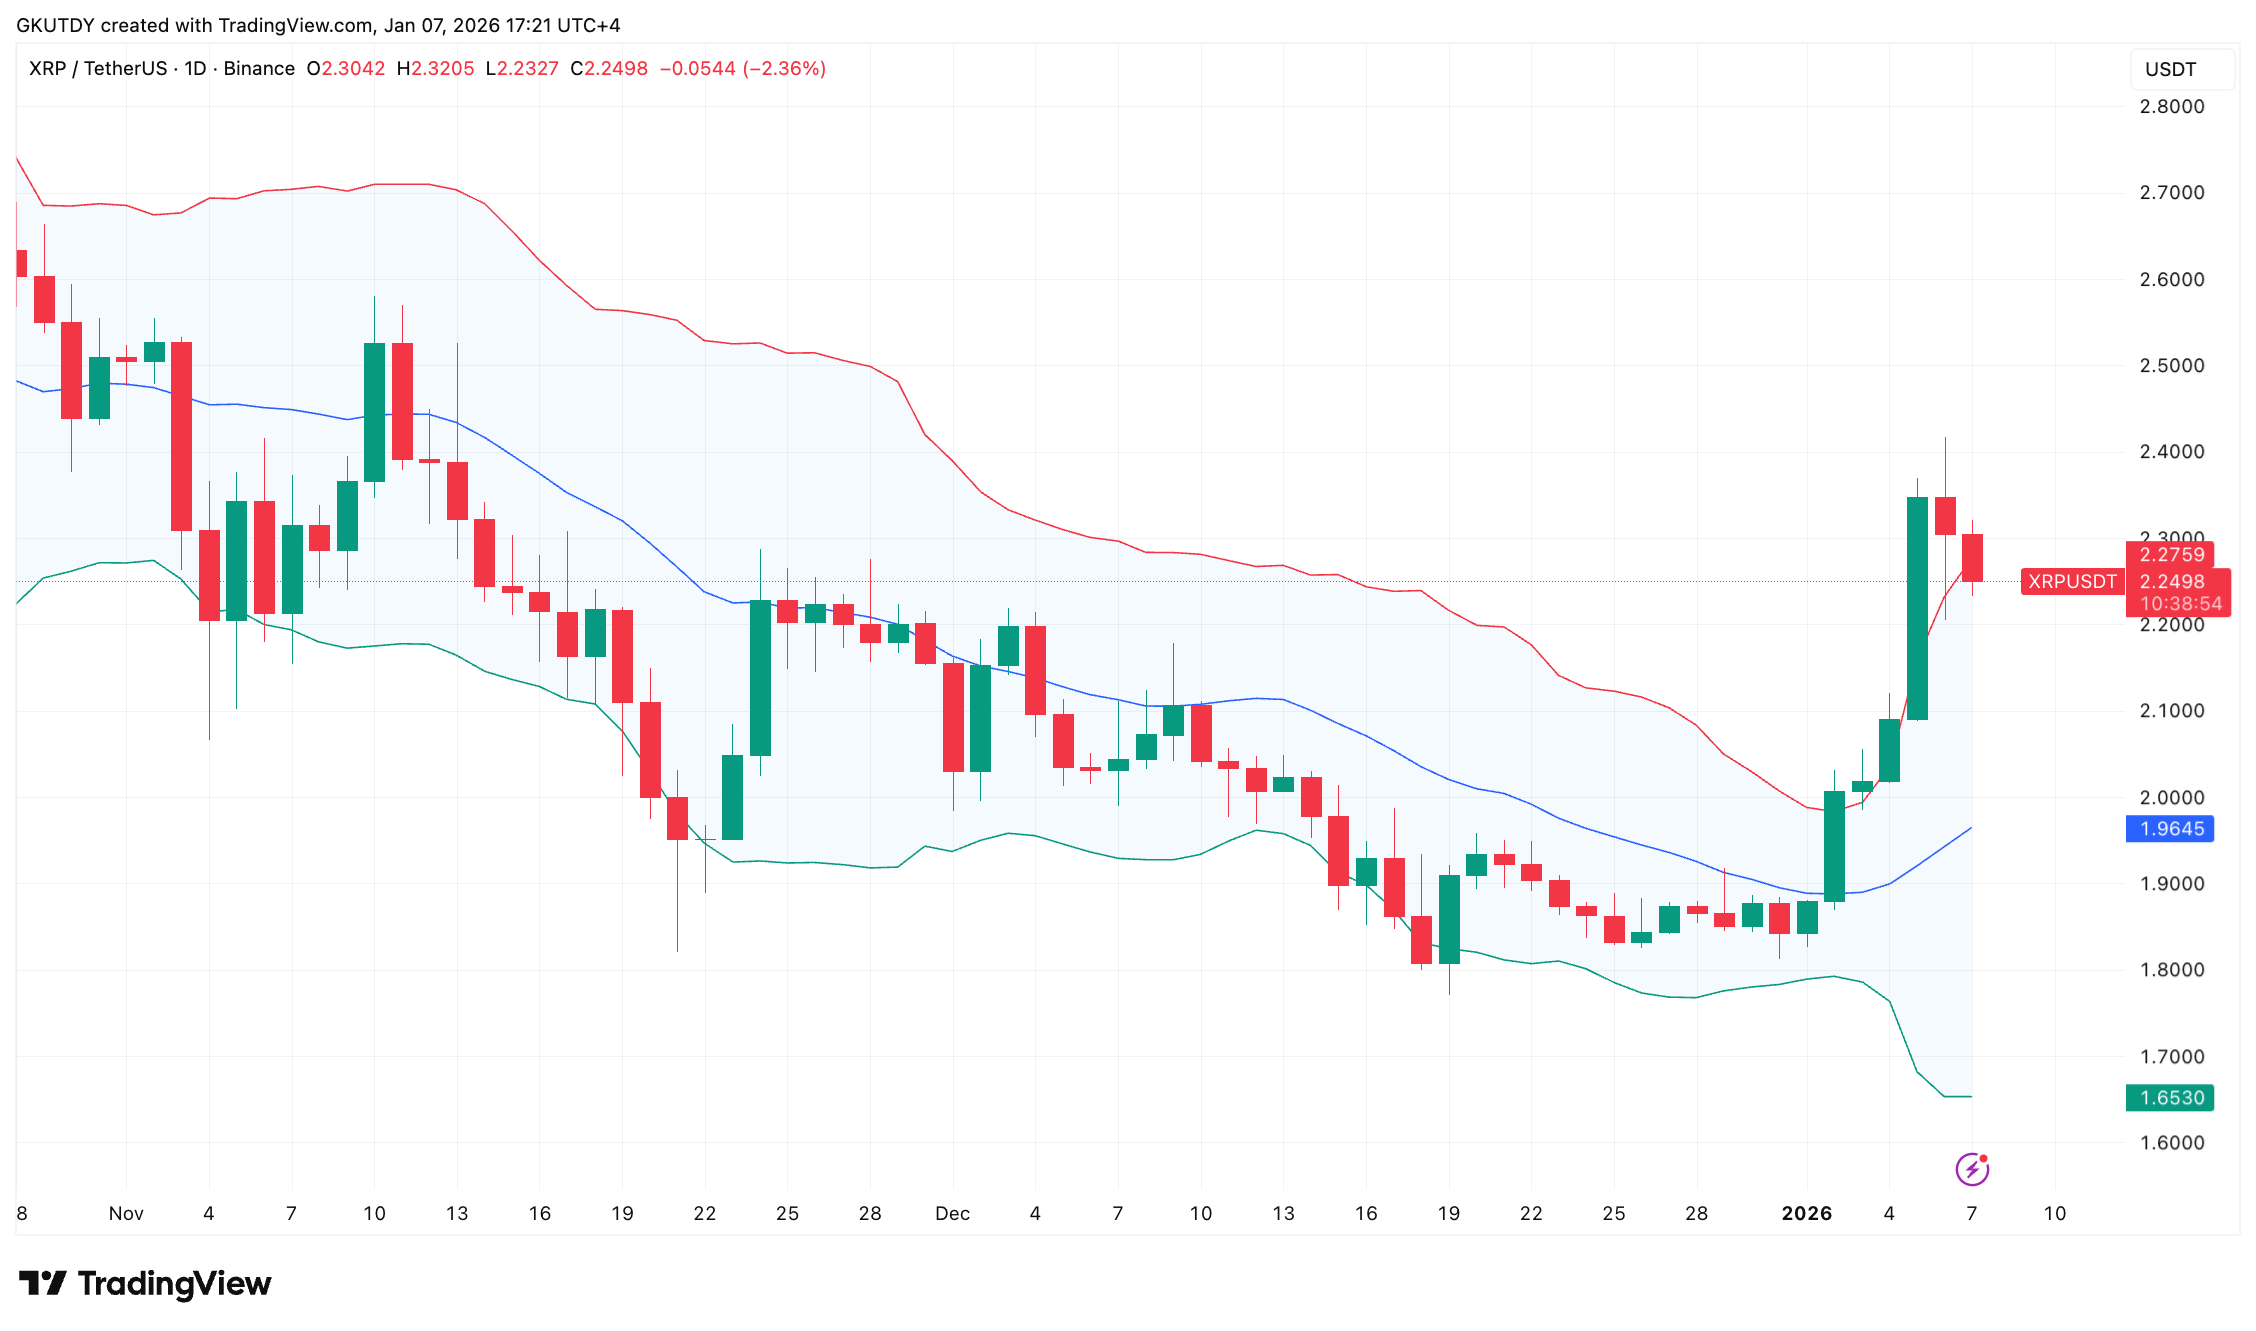
$XRP's weekend rally might have looked good at first, but the price action is already telling a different story, and the Bollinger Bands are showing it. After starting at $2.41 in early Monday trading, $XRP hit a wall, dropping almost 7% in the same day, as visible on the TradingView chart. It also started to lose steam right when it reached the upper boundary of the indicator's range.
The fourth biggest cryptocurrency is still trading below the midline of the Bollinger Bands on the weekly time frame, currently at $2.4254. Until $XRP closes decisively above this level, the market will see the bounce as a counter-trend move inside a still-valid downward channel that began back in late October.