
Key takeaways
- $SUI is up 17% in the last 24 hours and is now trading at $1.95.
- The rally comes as Mysten Labs researchers explore privacy features for blockchains, placing Sui alongside Ethereum and Solana in the account-based model.
$SUI tops $1.95 after 17% rally
$SUI, the native coin of the Sui blockchain, is up 17% in the last 24 hours, making it the best performer among the top 20 cryptocurrencies by market cap. The coin is now trading at $1.95, close to a two-month high, thanks to this rally.
The rally comes following a recent paper by Mysten Labs researchers that explores privacy features for blockchains, placing Sui alongside Ethereum and Solana in the account-based model.
The paper places Sui firmly within the account-based model, alongside Ethereum and Solana. It also looked at how such systems could implement confidential balances, limited anonymity sets, or sender-receiver unlinkability using cryptographic primitives such as homomorphic encryption and zero-knowledge proofs.
In addition to that, on-chain and derivatives data suggest growing market participation. Data obtained from Santiment shows that the Sui ecosystem’s trading volume reached $967.43 million on Tuesday, the highest since early December. This surge suggests that traders are taking an interest in Sui again following the poor performance recorded last month.
According to DeFiLlama, Sui’s Total Value Locked (TVL) has been steadily rising since the end of December, reaching $1.04 billion on Tuesday.
Furthermore, CoinGlass’s derivatives data shows that $SUI futures Open Interest (OI) at exchanges rose to $947.26 million on Tuesday, up from $685 million recorded a week ago.
$SUI could surge to the $2.34 level
The $SUI/USD 4-hour chart is bullish and efficient as Sui has added 34% to its value in the last seven days. The coin is now trading around $1.95 and could surge higher in the near term.
If the bullish trend continues, $SUI could extend the rally toward the weekly resistance level at $2.34. The momentum indicators currently support further bullish movements.
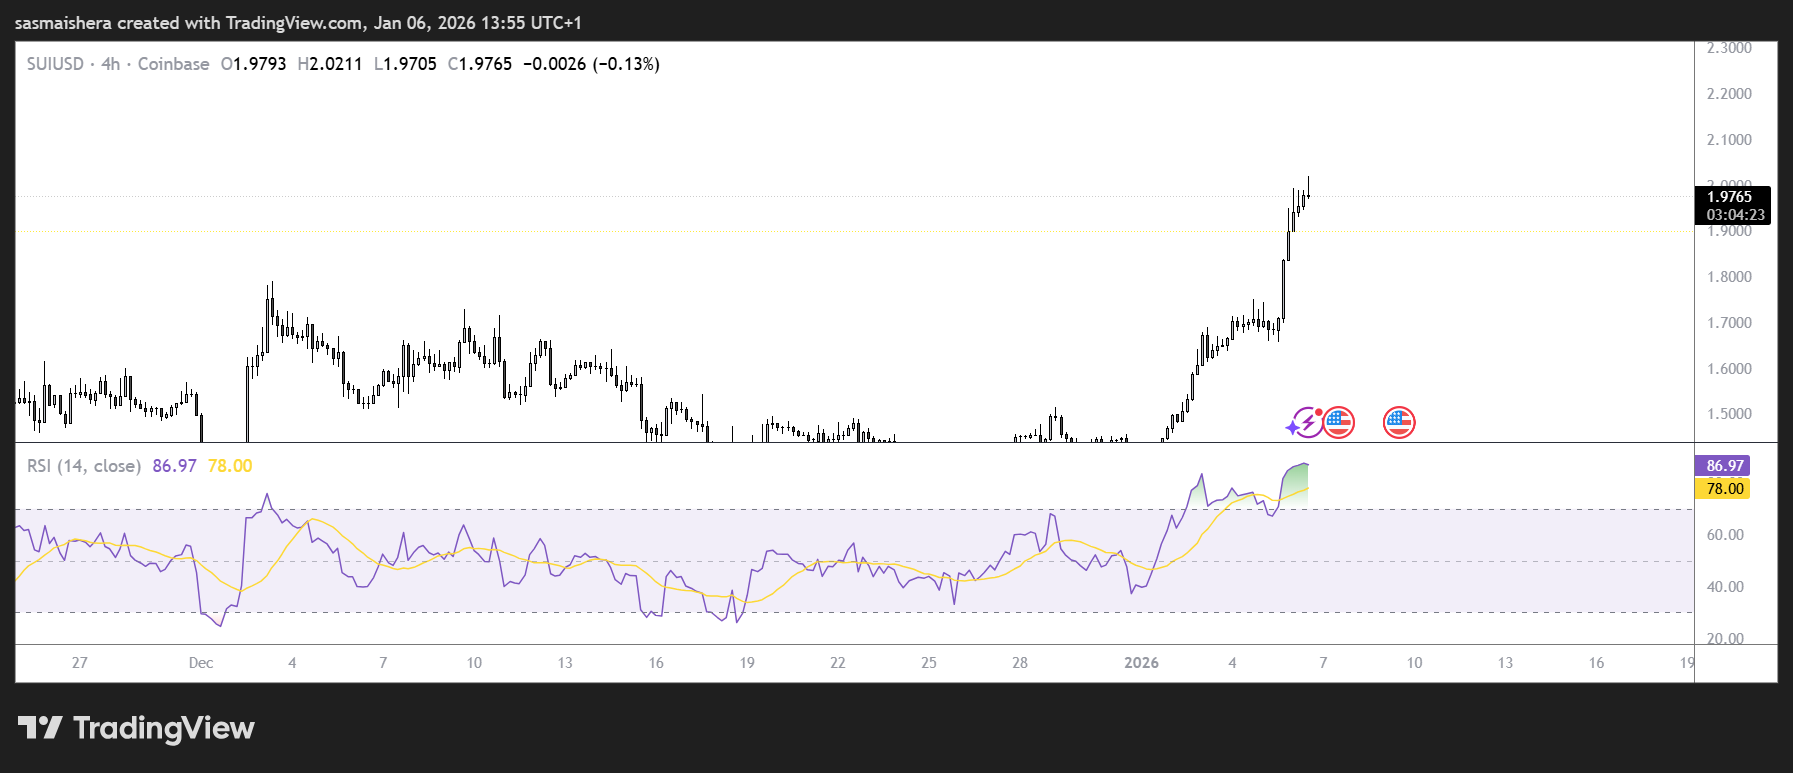 $SUI/USD 4H Chart">
The Relative Strength Index (RSI) on the 4-hour chart is 85, above the overbought threshold, indicating strong bullish momentum.
Furthermore, the Moving Average Convergence Divergence (MACD) indicator shows a bullish crossover and rising green histogram bars above the neutral level.
However, if the market undergoes a correction,
On the other hand, if $SUI corrects, it could extend the decline toward the 50-day EMA at $1.66.